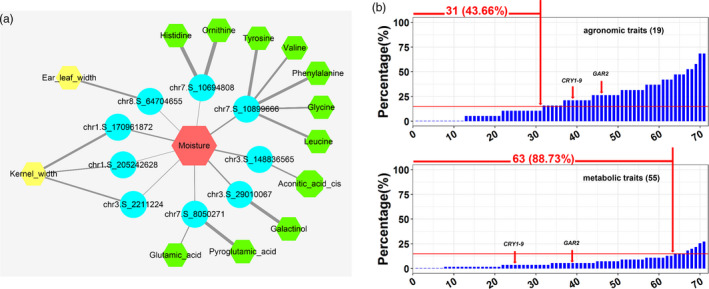
Figure 4.

Genetic correlations of grain moisture with agronomic and metabolic traits. (a) A network of moisture content, agronomic and metabolic traits mediated by shared important loci. The circles and hexagons represent significant loci and traits, respectively. Red indicates moisture content, while yellow and green indicate agronomic and primary metabolites, respectively. The thickness of the line represents the degree of significance (–logP value). (b) The proportion of other traits affected by the detected moisture‐related QTLs. The upper panel shows the influence of each moisture‐related QTL on agronomic traits (n = 19), while the lower panel shows the metabolic traits (n = 55) (P < 0.01). The red horizontal line indicates a proportion of 15%, which was used as a threshold to determine whether a moisture‐related QTL obviously affected an agronomic or metabolic trait.
