Figure 5.

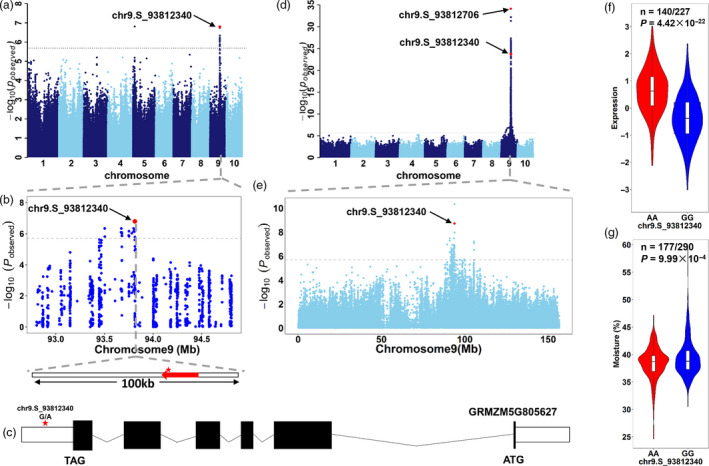
Candidate gene of a major QTL for moisture content. (a) Manhattan plot of GWAS for moisture content (34 DAP) at location 14WH. The lead SNP is indicated by a red dot. (b) Regional plot for the QTL on chromosome 9. The upper panel shows the p values of SNPs surrounding a 1‐Mb region upstream and downstream of the lead SNP. The lower panel indicates a 100 Kb region covering 50 Kb upstream and downstream of the lead SNP, where only one annotated gene (GRMZM5G805627, also named CRY1‐9) was found based on the maize reference genome. (c) Gene model of CRY1‐9. Solid boxes indicate exons, open boxes indicate untranslated regions (UTRs), and lines connecting the exons indicate introns. The red stars mark the positions of chr9.S_93812340. (d) Manhattan plot of GWAS for CRY1‐9 expression. The two key SNPs are indicated by red dots. (e) Regional Manhattan plot of conditional GWAS for CRY1‐9 expression. The GWAS for gene expression was repeated by fitting the original lead SNP (chr9.S_93812706) as a covariate. (f) The influence of chr9.S_93812340 on CRY1‐9 expression. (g) The influence of chr9.S_93812340 on moisture content. The significance of difference between two genotypes was evaluated using Student’s t‐test.
