
Figure 6.
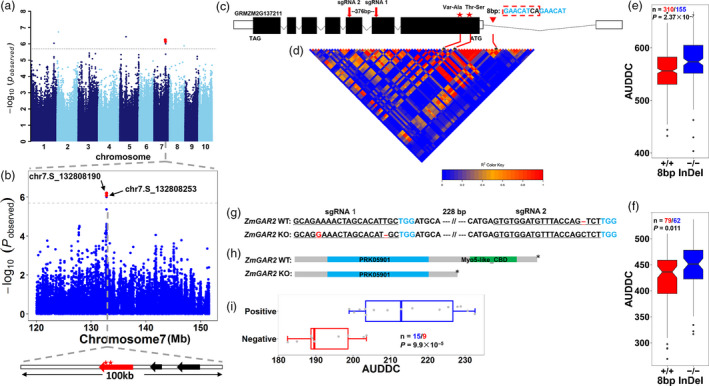
Identification of GAR2, a gene responsible for AUDDC in maize. (a) GWAS of the BLUP values for AUDDC_5_2. AUDDC_5_2 indicates the area under the dry‐down curve from 40 DAP to 58 DAP. The lead SNP underlying the QTL on chromosome 7 is indicated by a red dot. (b) Regional plot of the major QTL on chromosome 7. The top panel shows the p values of SNPs within a 15‐Mb region surrounding the lead SNP. The two most significant SNPs are indicated by red dots (P < 2.0 × 10⁻⁶). The bottom panel indicates a 100 Kb region surrounding the lead SNP that only contains three annotated genes (arrow) based on the maize reference genome. The red arrow indicates the candidate gene (GRMZM2G137211, also named GAR2) responsible for this AUDDC QTL. (c) Gene model of GAR2. Solid boxes indicate exons, while open boxes indicate untranslated regions (UTRs) and lines that connect exons represent introns. The red stars represent the two most significant SNPs that could cause amino acid substitutions (Val‐Ala and Thr‐Ser). The red triangle indicates the position of an 8 bp InDel (GAACATCA/‐) identified by gene resequencing. The red arrows indicate the positions of the two sgRNAs used for CRISPR‐Cas9 gene editing. (d) LD pattern of the GAR2 region. The heatmap indicates the pairwise r 2 values among the polymorphisms in a 0.1‐Mb region upstream and downstream of the lead SNP. The two most significant SNPs and the 8 bp InDel are indicated by red lines. (e) The effect of the 8 bp InDel on AUDDC values in the association‐mapping population. (f) The effect of the 8 bp InDel on AUDDC values in the F2:3 population. (g) Gene editing using CRISPR/Cas9. The red bases and line segment show variation and the blue bases show the PAM site. (h) Premature protein termination due to gene knockout. (i) The different AUDDC values between wild type and GAR2‐edited types via CRISPR‐Cas9. The comparison between different genotypes is based on Student’s t‐test.