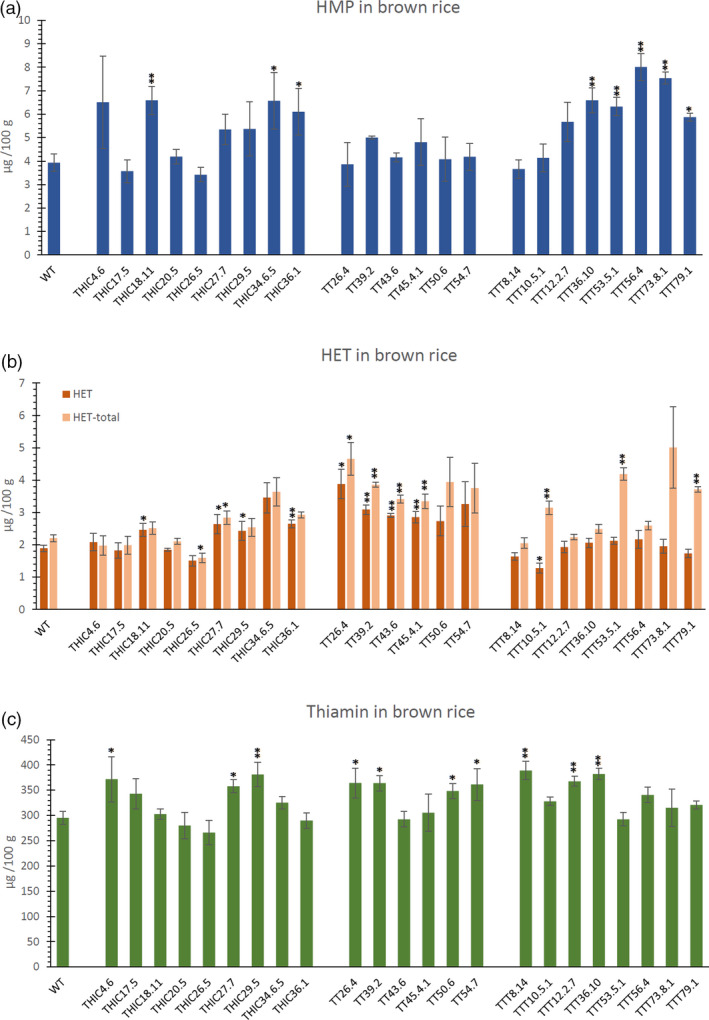
Figure 5.

Metabolite profiles in brown (unpolished) rice of the different engineered lines. In the different panels, the pyrimidine branch (HMP) is indicated in blue, the thiazole branch (HET(‐P)) in orange/red and thiamin in green. Levels (mean ± SE) of 4‐amino‐2‐methyl‐5‐hydroxymethylpyrimidine (HMP) (a), 4‐methyl‐5‐β‐hydroxyethylthiazole (HET) and HET‐total (sum of non‐phophorylated and phosphorylated HET) (b) and thiamin (c) as measured by quantitative LC‐MS/MS analysis. Metabolites were measured in dehusked unpolished, brown rice seeds. Analysis of metabolites was performed on at least three biological repeats (transgenic lines) and nine biological repeats (WT). Statistical difference (see Methods S2) in mean metabolite level compared to WT is indicated to be significant (single asterisk, P < 0.05) or very significant (double asterisks, P < 0.01).
