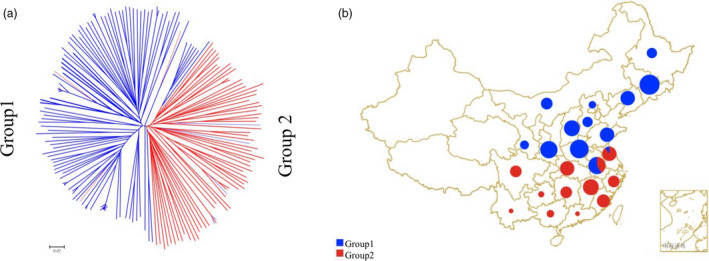
Figure 1.

Genetic relationship and geographic origins of the two groups within 182 wild soybean accessions. Two groups, group1 and group2, within the 182 wild soybean (G. soja) accessions identified by Population Structure analysis, are shown in blue and red, respectively. (a) Neighbour‐joining tree of the 182 accessions using Nei’s genetic distance. (b) The geographic origins of the 182 accessions. The size of the pie represents the number of accessions within the location.
