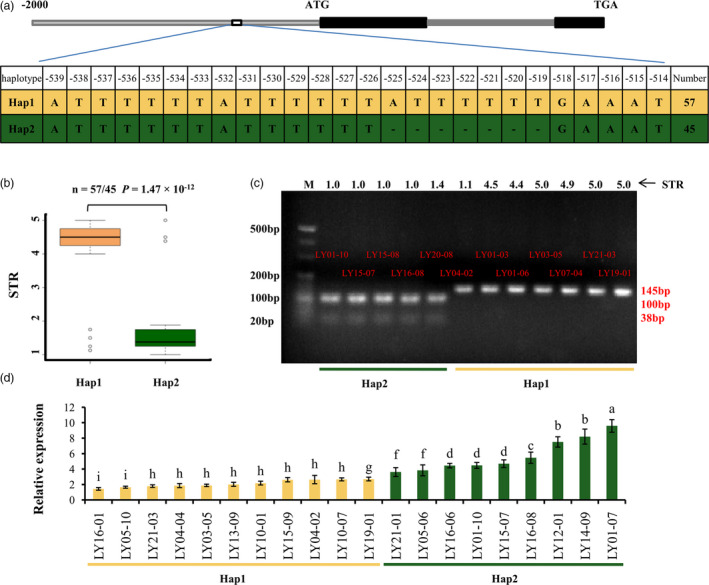
Figure 2.

Haplotype and relative expression analyses of GsERD15B. (a) Schematic graph shows the Insertion/Deletion (InDel) variation in the promoter region of GsERD15B gene and the corresponding two haplotypes, Hap1 and Hap2. (b) Boxplot of salt tolerance rating (STR) for two haplotypes. Statistical significance (P = 1.47 × 10⁻¹²) of the difference between two haplotypes was determined by two‐sided Wilcoxon test. The centre bold line represents the median; box edges indicate the upper and lower quantiles; whiskers show the 1.5 × interquartile range and points indicate outliers. (c) Electrophoresis shows dCAPS marker polymorphism for GsERD15B. Hap2 type can be cleaved by Ssp I enzyme, which produced DNA fragments of 100‐bp and 38‐bp. Hap1 type cannot be digested by Ssp I enzyme, leading to a single band of 145‐bp. DNA molecular weight marker is 20‐bp DNA Ladder. (d) Relative expression of GsERD15B in soybean response to salt stress. The relative expression of GsERD15B in soybean root tips (0–2 mm) at 12 h after salt stress (180 mm NaCl) was quantified by qRT‐PCR, using GmUKN1 as the reference gene and the corresponding samples under 0 mm NaCl as controls. Data represent the mean ± standard deviation of three replicates. Same letters above bars indicate no significant difference according to Duncan’s multiple range test at α = 0.05.
