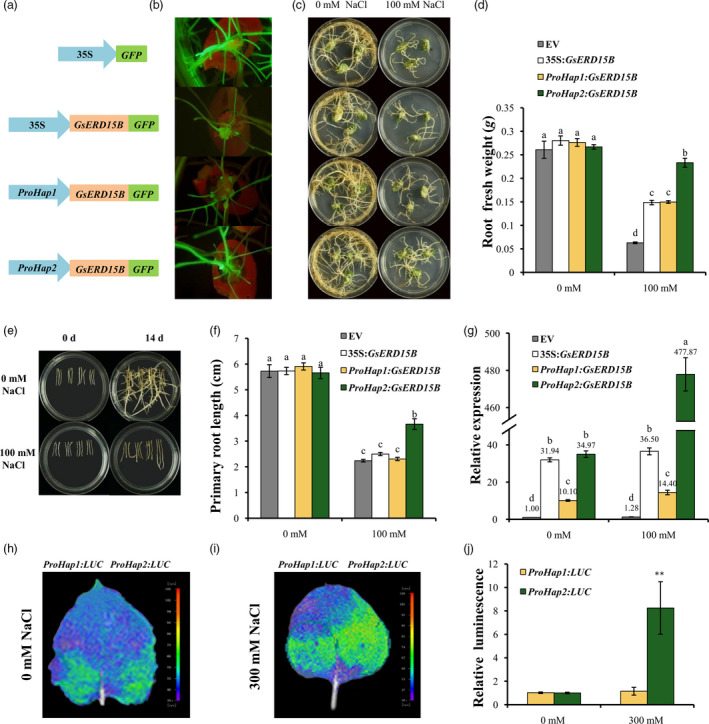
Figure 3.

Effect of different GsERD15B promoters on salt tolerance of soybean hairy roots and promoter activities. (a) Schematic diagram of different constructs using pBinGFP4 as the backbone vector, including the empty vector (EV) 35S:GFP, 35S:GsERD15B, ProHap1:GsERD15B and ProHap2:GsERD15B. ProHap1 and ProHap2 represent the promoters from two haplotypes (Hap1 and Hap2) of GsERD15B gene, respectively. The GsERD15B gene was expressed in fusion with green florescence protein (GFP). (b) The fluorescence signal of transgenic soybean hairy roots. (c) Phenotypes of transgenic soybean hairy roots under control (0 mm NaCl) or salt stress (100 mM NaCl). Photographs were taken 14 day after treatment. From top to bottom represent the hairy roots of EV, 35S:GsERD15B, ProHap1:GsERD15B and ProHap2:GsERD15B, respectively. (d) Fresh weights of soybean hairy roots under control (0 mM NaCl) or salt stress (100 mM NaCl) for 14 day. (e) Phenotypes of regenerated transgenic soybean hairy roots under 0 or 100 mM NaCl treatment. Photographs were taken at 0 day and 14 day after treatment, respectively. From left to right in each Petri dish represents empty vector (EV, pBinGFP4), 35S:GsERD15B, ProHap1:GsERD15B and ProHap2:GsERD15B, respectively. (f) Primary root lengths at 14 day after treatment. (g) Relative expression of GsERD15B gene in soybean hairy roots at 3 h after 0 or 100 mM NaCl treatment by qRT‐PCR. For relative expression calculation, the sample from soybean hairy roots with empty vector (EV, pBinGFP4) under 0 mM NaCl was used as control and GmUKN1 was the reference gene. Same letters above bars indicate no significant differences according to Duncan’s multiple range test at 0.05 level. Soybean variety of Tianlong1 was used. Data represent the mean ± standard deviation of three biological replications and each replication has at least four independent roots for each genotype (n ≥ 12). (h‐j) Promoter activity of two GsERD15B haplotypes by transient expression in tobacco leaves after 0 or 300 mM NaCl treatment for 16 h. The LUC reporter gene was driven by each haplotype promoter. The photographs were taken using in vivo plant imaging system, and the luminescence intensity in h and i was shown in j. ** indicates significant difference in the LUC activity between ProHap1:LUC and ProHap2:LUC at 0.01 level by Student’s t‐test (n = 6).
