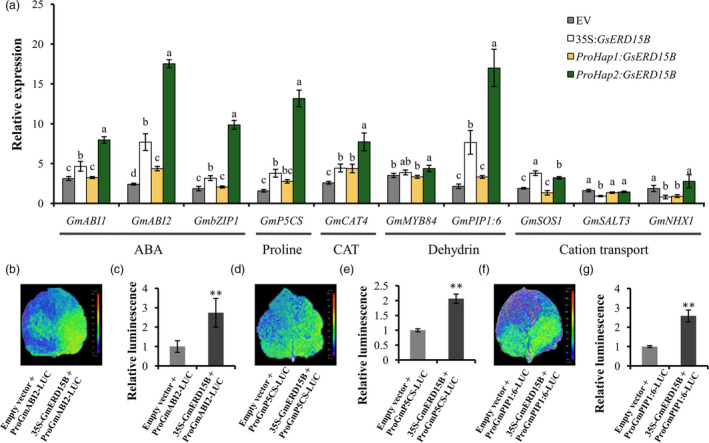
Figure 7.

Relative expression patterns of stress‐related genes in transgenic soybean hairy roots and promoter activity assays. (a) Relative expression levels of stress‐related genes at 3 h after 100 mM NaCl treatment in soybean hairy roots transformed by empty vector (EV, pBinGFP4), 35S:GsERD15B, ProHap1:GsERD15B or ProHap2:GsERD15B, respectively. Root samples without salt stress (0 mM NaCl) were used as the controls. Data represent mean ± standard deviation of four biological replications (n ≥ 12). Same letters above bars for each gene indicate no significant difference between genotypes according to Duncan’s multiple range test at 0.05 level. (b, d, f) Promoter luciferase (LUC) assays in tobacco leaves to reveal the promoter activity of GmABI2, GmP5CS and GmPIP1:6. (c, e, g) Quantitative analyses of the LUC activities from tobacco leaves shown in b, d and f. ** represent significant difference at 0.01 level by Student’s t‐test (n = 6).
