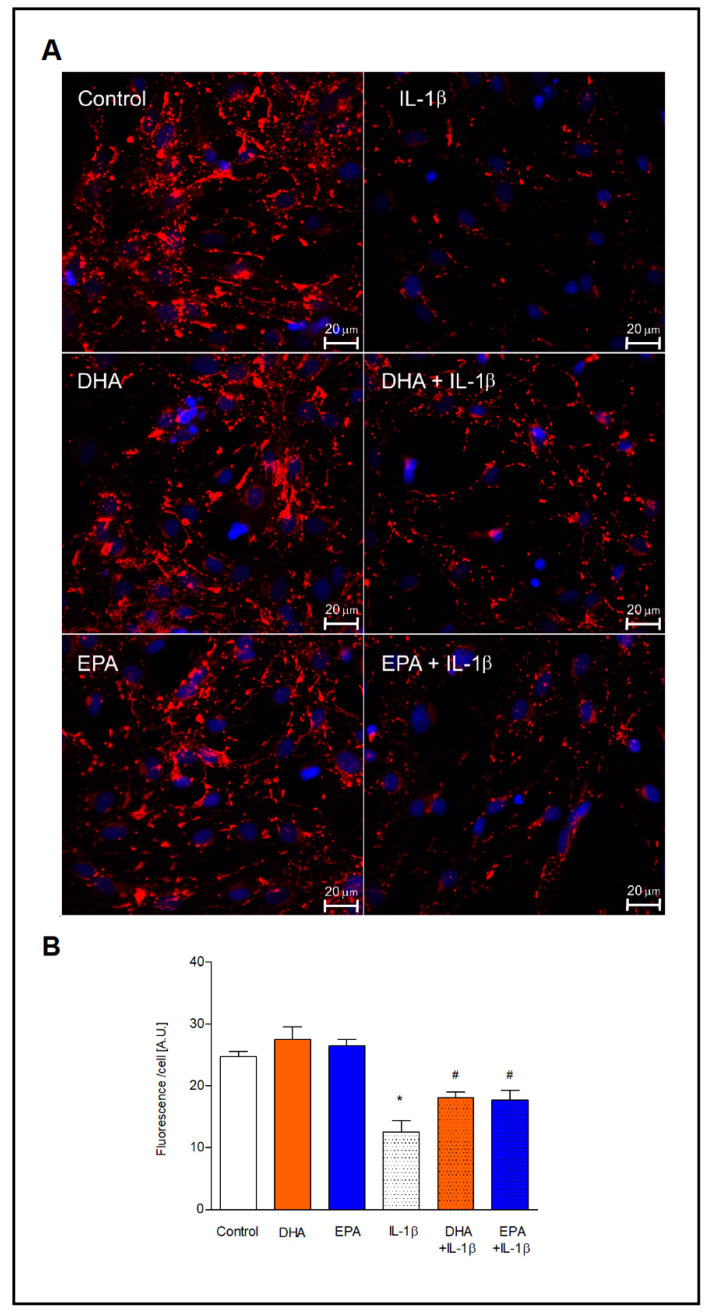
Figure 5.
Expression of connexin 43 in astrocytes. (A) Representative fluorescence images depicting the double immunostaining of connexin 43 (red) with DAPI (blue). The cells were incubated with 30 µM of DHA and EPA for 24 h and then treated with 10 ng/mL 1L-1β for 16 h. (B) Quantification of the immunofluorescence signal in the cells. The number of cells in the field was counted and an average fluorescence intensity value per cell was calculated * p < 0.001 compared to unstimulated control cells, # p< 0.05 compared to IL-1β-treated cells.

