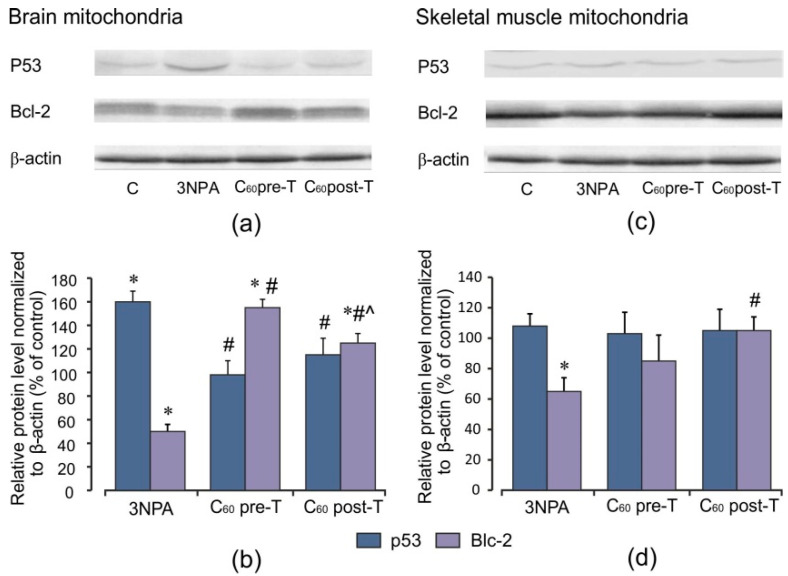
Figure 7.
Effect of C60 and 3-NPA administration on p53 and Bcl-2 protein expression in brain and skeletal muscle mitochondria. (a,c) Representative Western blot and (b,d) densitometric analysis of p53 and Bcl-2 protein contents. Protein extracts were separated by performing SDS PAGE and subsequently electroblotted onto PVDF membranes. The values of the p53 and Bcl-2 proteins were normalized to β-actin. Final Western blot figure as the histogram is expressed as mean percentages (±SD) over control values from two independent experiments. The control values are taken as 100%. Statistically significant differences are indicated as * p < 0 05 vs. control; # p < 0 05 vs. 3-NPA treated rats; ^ p < 0.05 vs. C60 pre-T group.

