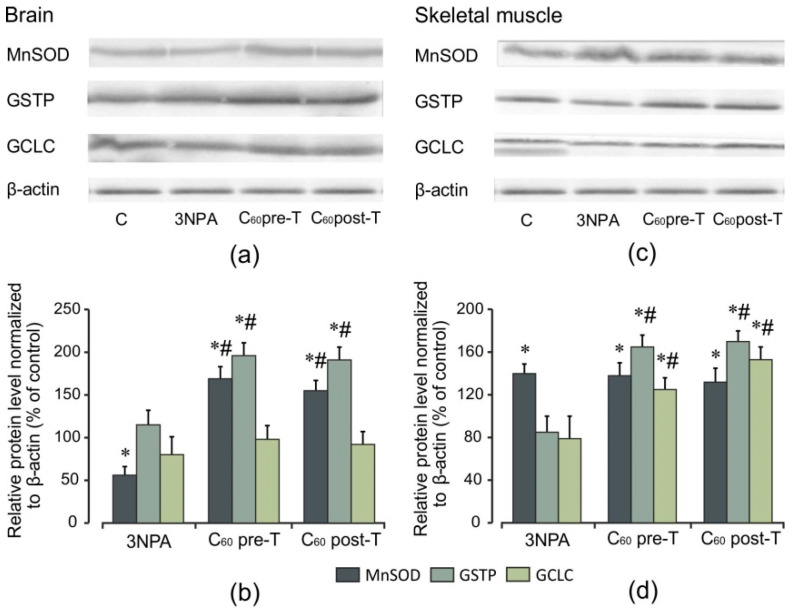
Figure 9.
Effect of C60 and 3-NPA administration on MnSOD, GSTP, GCLC protein expressions in brain and skeletal muscle mitochondria. (a,c) Representative Western blot and (b,d) densitometric analysis of protein levels. Protein extracts were separated by performing SDS PAGE and subsequently electroblotted onto PVDF membranes. The values of the proteins were normalized to β-actin. Final Western blot figure as the histogram is expressed as mean percentages (±SD) over control values from two independent experiments. The control values are taken as 100%. Statistically significant differences are indicated as * p < 0 05 vs. control; # p < 0 05 vs. 3-NPA treated rats.

