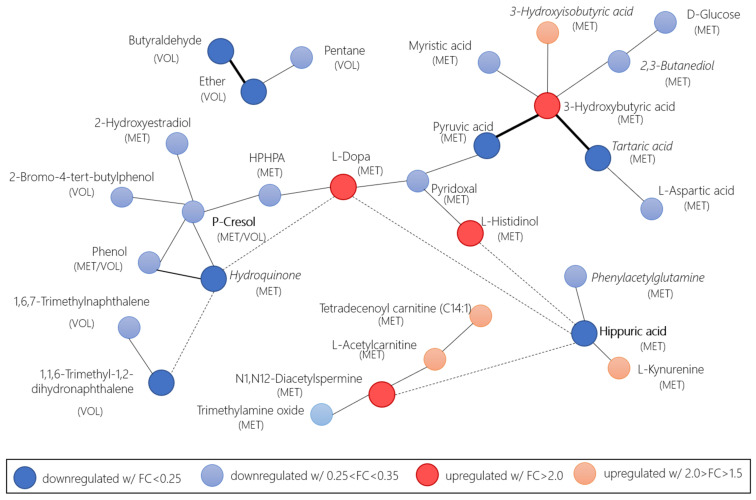
Figure 6.
Network of relevant compounds in the comparison of CRC and adenomas versus control and CRC pre- and post-surgery, calculated by the weighted p-value and fold-change with MetaMapp biochemical mapping. Red nodes of upregulated compounds with FC > 2.0 (dark red) and 2.0 > FC > 1.5 (light red). Blue nodes downregulated with FC < 0.25 (dark blue) and 0.25 < FC < 0.35 (light blue). Thicker edges indicate that the relevant compounds are found in the volcano plot with log2FC above/below +2.0/−2.0. Dashed edges indicate that they are only reported for the log2FC above/below +2.0/−2.0 compounds. Bold names indicate compounds found in both the case-control and pre-/post-surgery groups. Compounds in the cursive were only found in the pre-/post-surgery group. HPHPA is the 3-(3-Hydroxyphenyl)-3-hydroxypropanoic acid.

