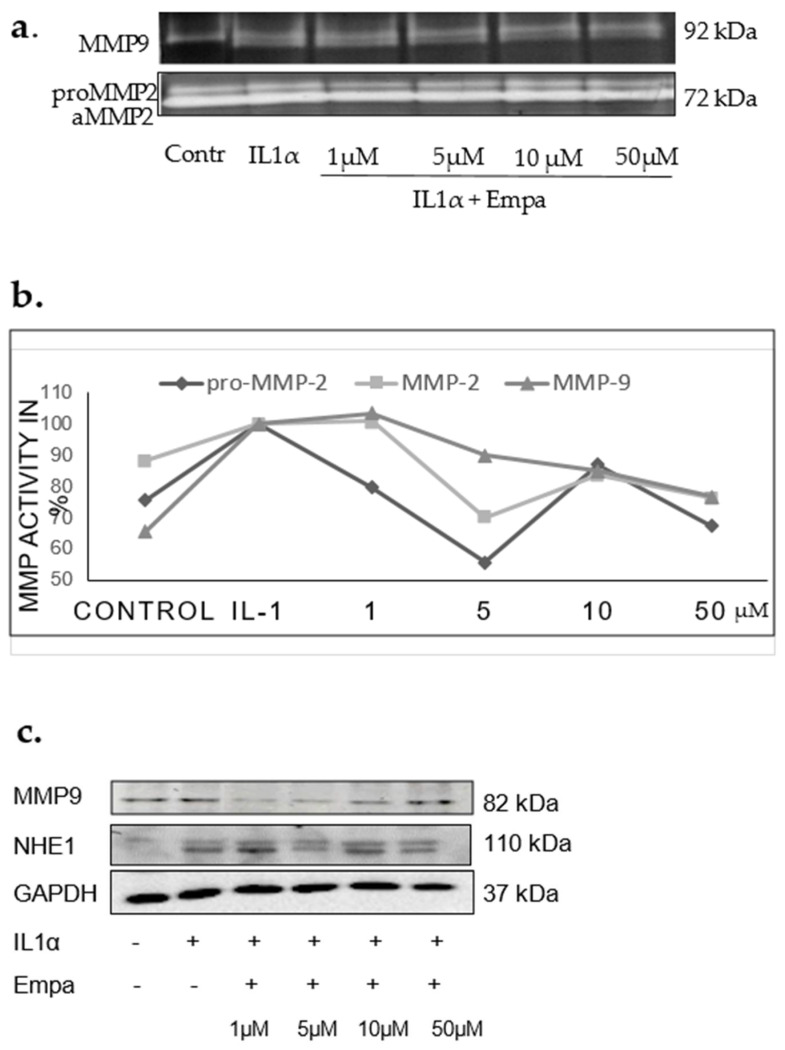
Figure 5.
(a) Gelatin zymography, H9c2 cells, representative zymogram (b). Results from 3 experiments, 3 replicates; proMMP2, MMP2, MMP9 activity related to control after stimulation with IL1α and treatment with Empa 1, 5, 10, 50 µM. (c) Representative Western blots of MMP9, NHE1, GAPDH expression in H9c2 cells, 48 h after stimulation with IL1α.

