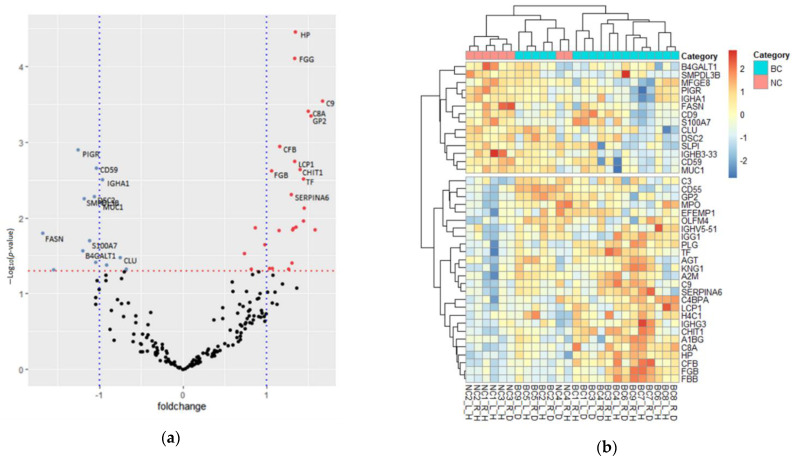
Figure 2.
Differentiated protein expression between NC and BC NAF (a) Volcano plot of protein fold-change across the NC and BC NAF samples plotted against the unpaired student t-test p-value. Red dashed line shows a p-value cut off = 0.05; (red spots = upregulated proteins, blue spots = downregulated proteins). (b) Hierarchical clustering of proteins differentially expressed between NC (pink) and BC (blue), plotted as a z-score for each sample (red = up, blue = down) (right/left breast = R/L, healthy/disease breast = H/D between bilateral samples).

