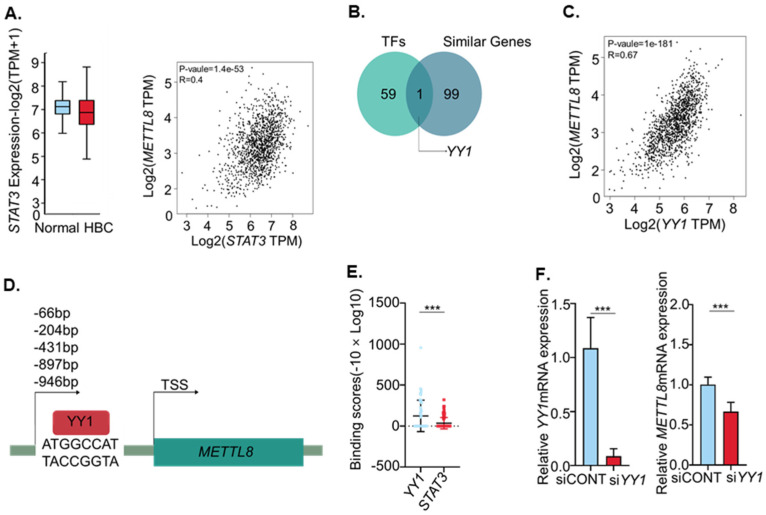
Figure 2.
(A) Boxplot showing relative expression of STAT3 in breast cancer. The correlation between STAT3 and METTL8 expression in breast cancer was analyzed in gepia2 (http://gepia2.cancer-pku.cn; accessed on 20 May 2020). (B) Venn diagram showing the intersection of genes whose expression is genes similar in expression to expression of METTL8 in breast cancer from TCGA and/or GTEx expression data accessed via gepia2 (http://gepia2.cancer-pku.cn; accessed on 20 May 2020) with the genes identified as METTL8 putative transcription factors by PROMO (http://alggen.lsi.upc.es; accessed on 20 May 2020). (C) The correlation between YY1 and METTL8 expression in breast cancer was analyzed in gepia2 (http://gepia2.cancer-pku.cn; accessed on 20 May 2020). (D) The binding site of transcription factor YY1 is estimated by PROMO (http://alggen.lsi.upc.es; accessed on 20 May 2020). (E) Peak-call data of the same antigens were collected from public datasets, and MACS2 scores (−10 × Log10 (MACS2 Q-value)) are displayed binding scores for METTL8. (F) YY1 and METTL8 mRNA levels were analyzed by RT-qPCR 48 h after YY1 knocked-down in MDA-MB-231 cells as compared with the control. *** indicates p < 0.001, HBC: human breast cancer.

