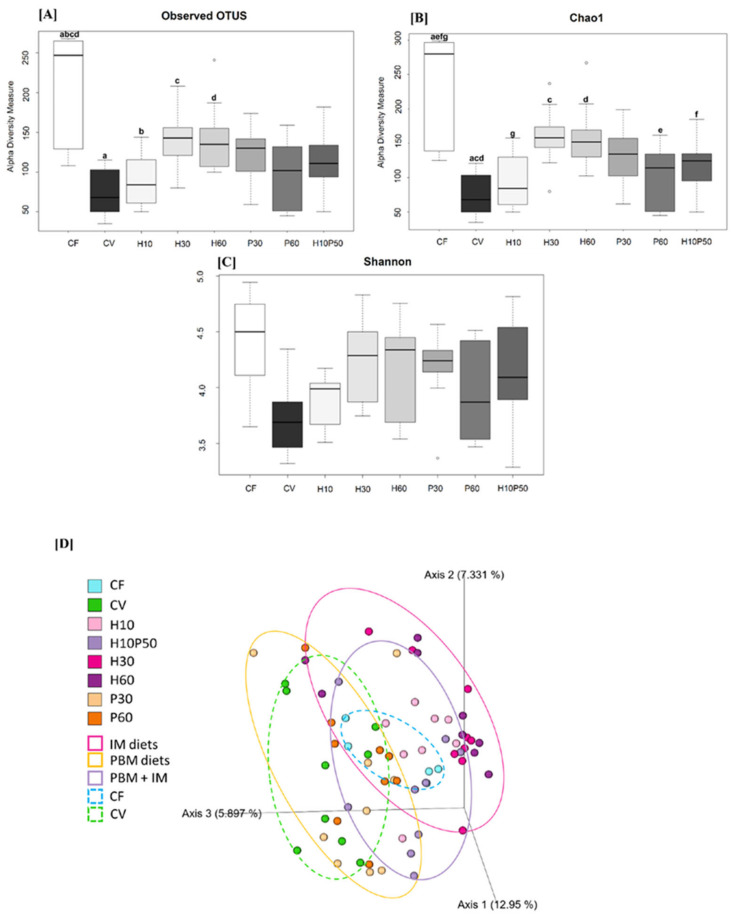
Figure 1.
Intestinal bacterial α-diversity (Observed features (A), Chao1 (B) and Shannon index (C)), and β-diversity (Unweighted Unifrac PCoA plot (D)) in rainbow trout fed fish-meal (CF), vegetable meal (CV), increasing percentage of Hermetia illucens insect meal (H10, H30, H60), increasing percentage of poultry by-product meal (P30, P60), and a combination of insect meal and poultry by product meal (H10P50) (n = nine fish per group). Within each panel, identical superscript letters indicate statistically significant differences (FDR p < 0.05).

