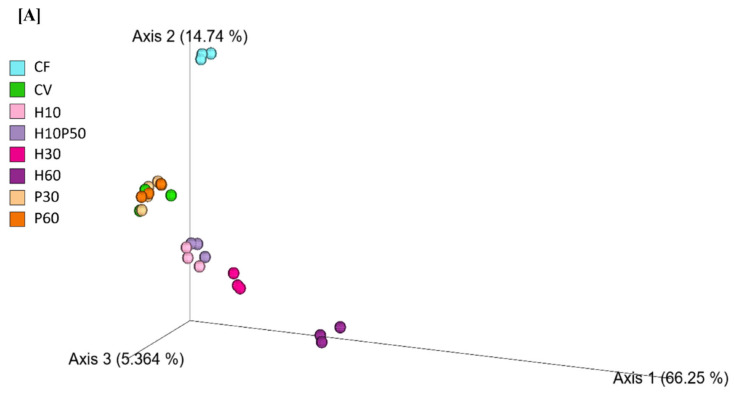
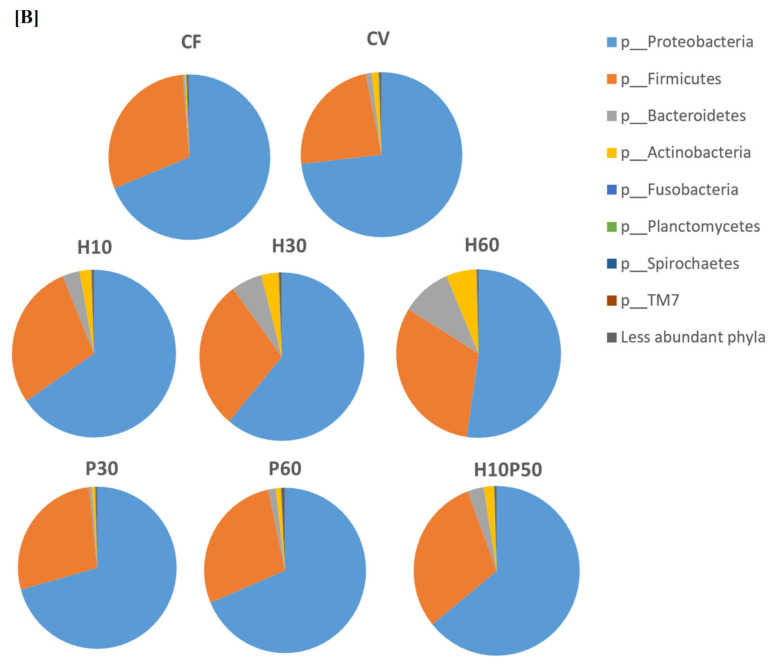
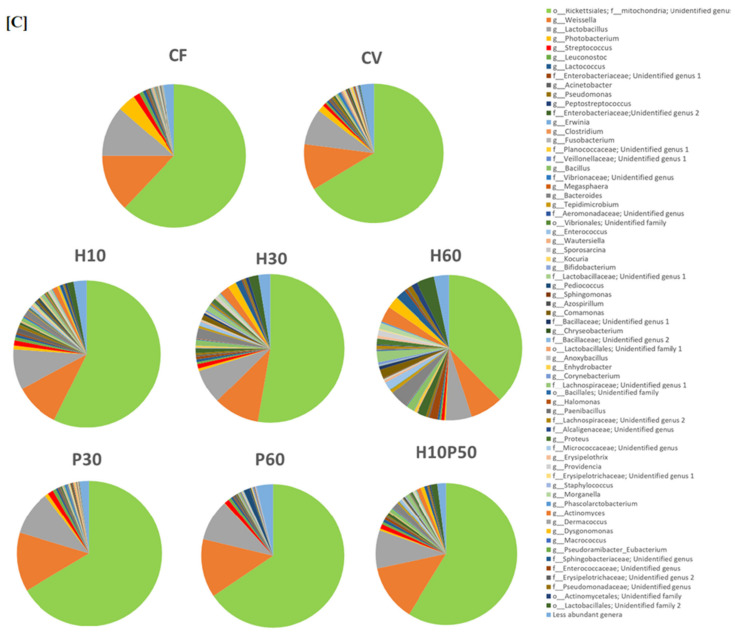
Figure 3.
(A) PCoA representing the β-diversity of microbial populations in fish feed, according to Bray–Curtis dissimilarity (p < 0.001). Percentage relative abundance of phyla (B) and genera (C) in fish feed. Unassigned phyla or genera include those with percentage sequence homology less than 95% with the Greengenes database. Less abundant phyla or genera include bacteria with a relative abundance less than 0.01% in fewer than 25% of samples.


