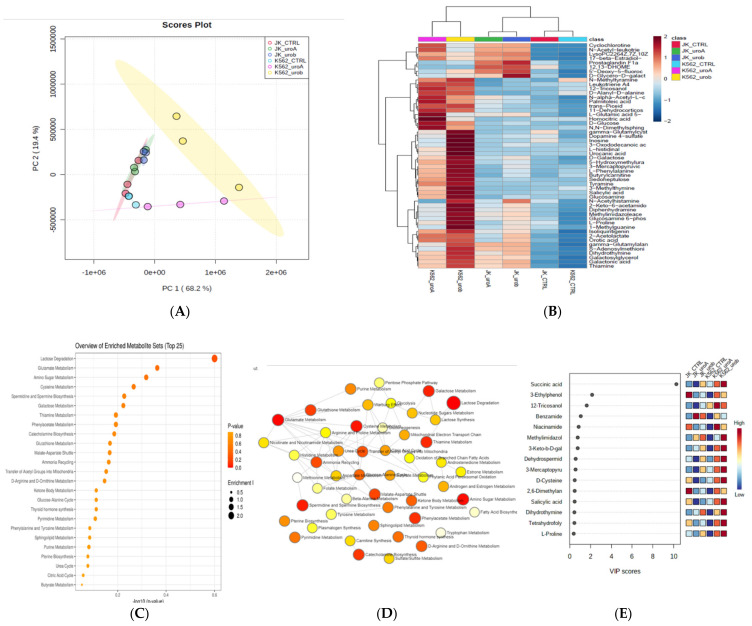
Figure 2.
Metabolomic analysis of leukemic cells treated with urolithin A and B for 48 h: (A) PCA analysis of total metabolites of Jurkat and K562; (B) expression heat map of differential metabolites expressed in control and urolithin A- and urolithin B-treated cells; (C) top pathways enriched in Jurkat and K562 control and urolithin A- and urolithin B-treated cells; (D) pathway network analysis of Jurkat and K562 control and urolithin A- and urolithin B-treated cells; (E) VIP score for differentially expressed metabolites during urolithin A and B treatment.

