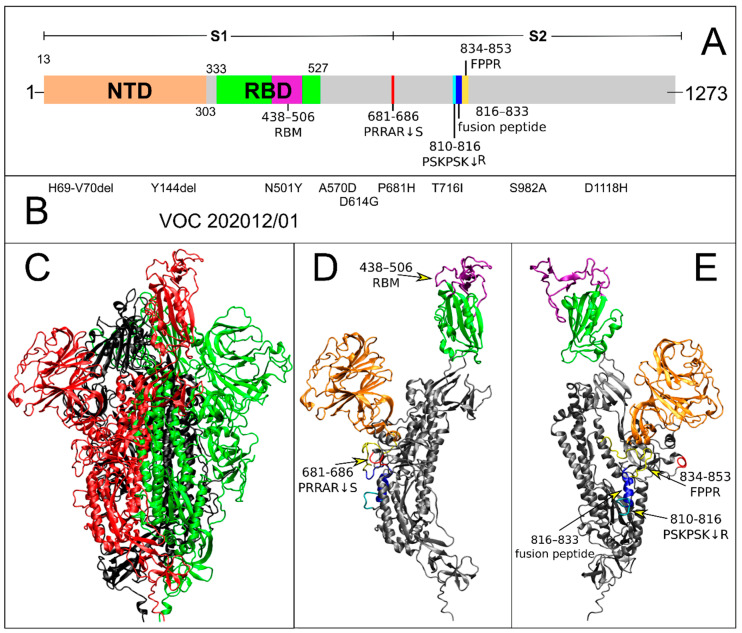
Figure 1.
Domain organization and UK variant sequences in the S protein. (A) The S protein is divided in two regions, S1 and S2. In S1, the NTD and RBD are colored in orange and green, respectively. Within the RBD, the RBM is highlighted in purple. The newly acquired furin-like cleavage site at the S1/S2 boundary is highlighted in red. The two neighboring second cleavage site [35] and fusion peptide regions are highlighted in cyan and blue, respectively. (B) The VOC 202012/01 mutations are mapped along the S protein sequence. (C) Cartoon representation of the WT snapshot after 629.8 ns of MD simulation, centroid of the most populated protein cluster. The three monomers are colored in black, red, and green, respectively. Monomer 2 is the one in up conformation. (D,E) Monomer 2 of the same MD snapshot in two different orientations. S protein key regions are colored and highlighted as in panel A.

