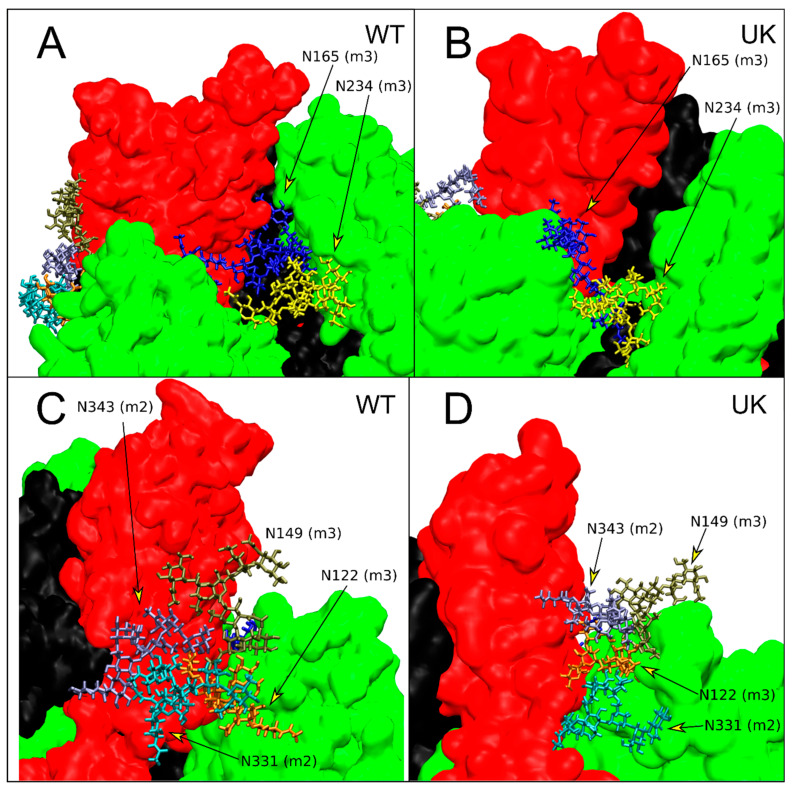
Figure 6.
Interactions of N-glycans with RBD domain in up conformation (monomer 2, red color). Monomer colors as in Figure 1C. (A,B) Enlargement of the region of interaction of N165 and N234 of monomer 3 (green color) for WT and UK, respectively. (C,D) Enlargement of the region of interaction of N122 and N149 of monomer 3; N331 and N343 of monomer 2 (red color) for WT and UK, respectively. For each residue, the monomer to which they belong is reported in parentheses.

