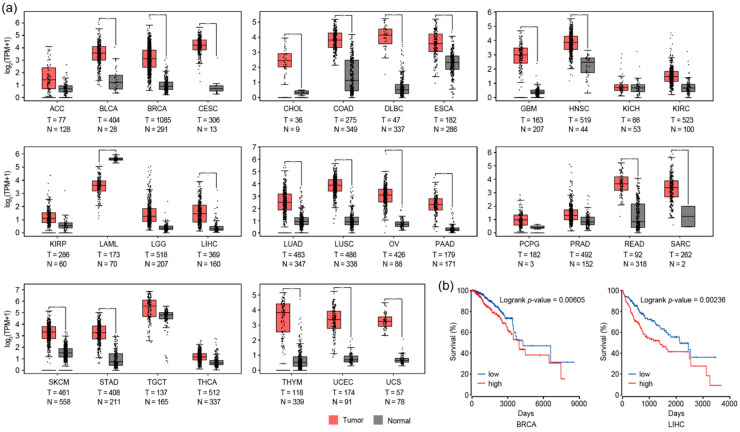
Figure 4.
Expression levels of the RAD51 gene in various types of cancer. (a) Box plots show normalized expression levels (transcripts per kilobase million, TPM) of the RAD51 gene in tumor tissues and corresponding normal controls. *p-value < 0.01. (b) The prognosis of patients diagnosed with BRCA or LIHC was estimated and plotted in Kaplan–Meier survival plots. The patients were divided into two groups (high and low) based on the expression level of the RAD51 gene.

