
Fig. 7.
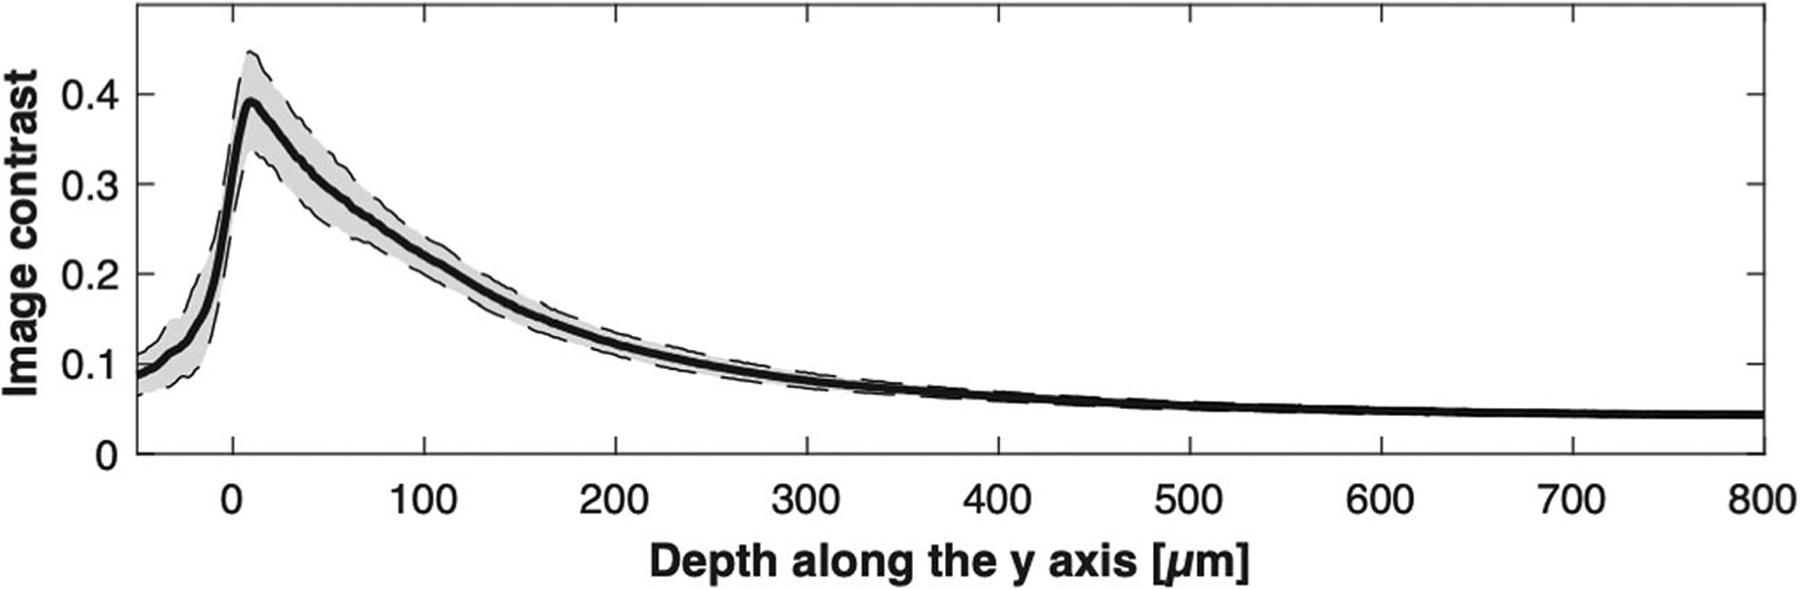
Contrast as a function of the depth along the y-axis for the swine kidney images. Solid line, average of contrast curves for the 120 images; dotted lines, standard deviation.
Official websites use .gov
A
.gov website belongs to an official
government organization in the United States.
Secure .gov websites use HTTPS
A lock (
) or https:// means you've safely
connected to the .gov website. Share sensitive
information only on official, secure websites.
Contrast as a function of the depth along the y-axis for the swine kidney images. Solid line, average of contrast curves for the 120 images; dotted lines, standard deviation.