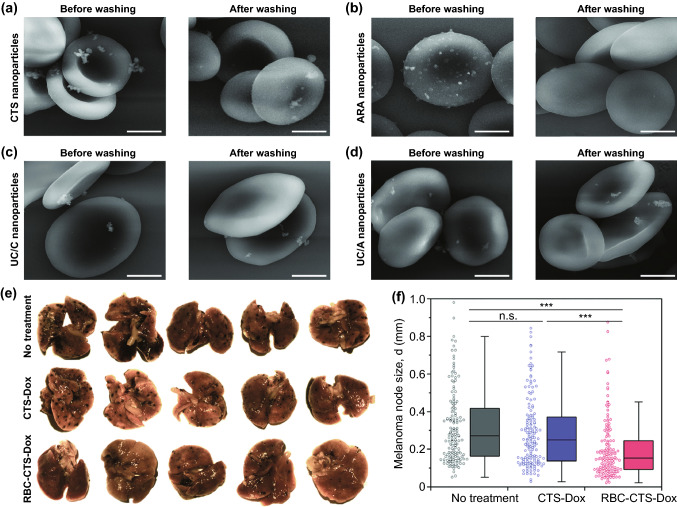
Fig. 2.
Electron microphotographs of erythrocyte complexes with a chitosan (CT), b glucuronic acid, c cationic non-coated, and d anionic non-coated 100 nm nanoparticles (scale = 2 μm) before and after washing. e Images of metastatic foci on lung tissues excised from untreated animals, animals treated with CT-doxorubicin nanoparticles and RBC bound-CT-doxorubicin nanoparticles in metastatic melanoma murine model f melanoma node size (mm3) (data representing 100 metastasis in each group, distinct values represented by Tukey-type box plots. Statistical implications determined using Welch’s t test (n.s,***P < 0.001*,*P < 0.01, and P > 0.05).
Adapted from Ref. [86] with permission from Royal Society of Chemistry RSC

