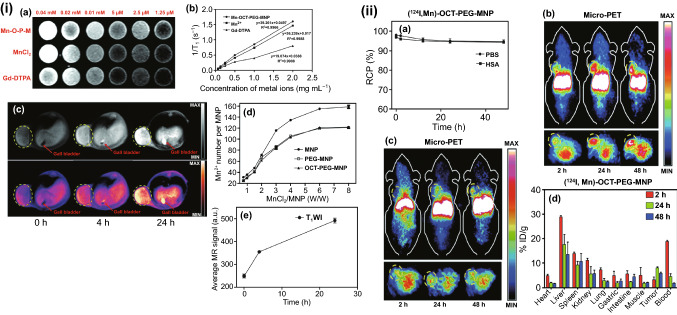
Fig. 4.
(i) In vitro and in vivo MRI analysis of Mn2+—OCT-PEG-MNPs: a T1-weighted MRI images at 1.5 T, TR: 531 ms, TE: 9.1 ms of Mn2+ -OCT-PEG-MNPs (upper panel), MnCl2 (middle panel), Gd-DTPA (bottom panel) with various concentrations (2.0, 1.0, 0.5, 0.25, 0.125, and 0.0625 mg mL−1. b in vitro T1-linear relaxation rates (1/T1, s−1) of Mn-OCT-PEG-MNPs, Mn2+ and Gd-DTPA measured. c Axially imaged T1-weighted MR images of NCI-H469 mice ((tumor site enveloped by a yellow dotted line, and gall bladder was indicated by a red line) before and after i.v, tail injection of Mn2+-OCT-PEG-MNPs(TR: 531 ms, TE: 9.1 ms. d Relationship of Mn2+ attached on one MNP, PEG-MNP, and OCT-PEG-MNP and feed ratio (WMn/WMNPS). e Quantitative analysis of signaling intensity at the tumor site at various time intervals. (ii) 5 PET analysis of 124I labeled Mn+2-OCT-PEG-MNPs. a In vitro stability analysis of (124I, Mn+2)-OCT-PEG-MNPs in 5% HSA solution and PBS (pH = 7.4). b The sagittal plane (upper panel) and transaxial (bottom panel). Micro-PET images of NCI-H69 tumor (tumor site enveloped by a yellow dotted line) scanned at 2, 24, and 48 h after tail vein injection of (124I, Mn+2)-OCT-PEG-MNP. c Micro-PET imaging of A549 tumor mice at 2, 24, and 48 h after tail intravenous injection of (124I, Mn+2)-OCT-PEG-MNPs. d Biodistribution of (124I, Mn+2)-OCT-PEG-MNPs in NCI-H69 tumor mice (n = 3) measured by gamma scintillator at 2, 24, and 48 h after tail vein injection (data expressed as % ID g−1 ± SEM.
Adapted from Ref. [278] with permission from The Royal Society of Chemistry, Copyright 2019

