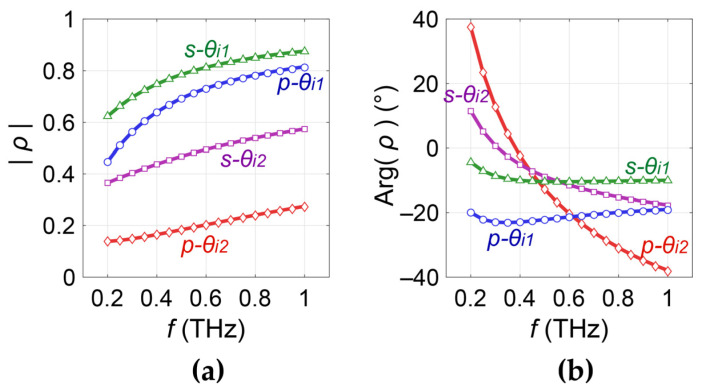
Figure 13.
(a) The amplitude and (b) phase of the reflection ratios calculated for the four experimental geometries, indicated by s-θi1, p-θi1, s-θi2, and p-θi2. The symbols are the results from the layered model and the solid curves are the results from the anisotropic model [53].

