Figure 3.
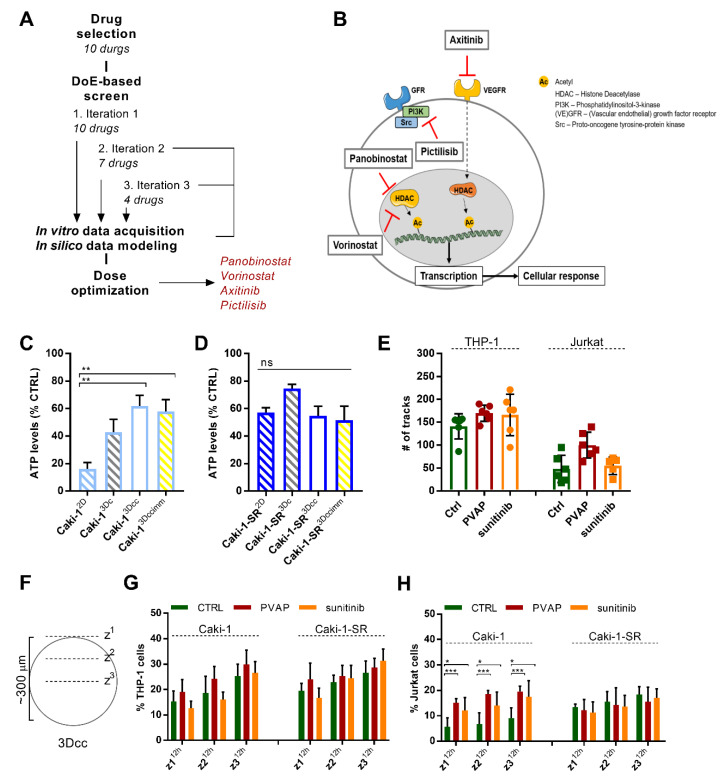
Optimized multidrug combination for validation of the 3Dccimm models in comparison to clinically applied treatment sunitinib. (A). The pipeline of a multidrug screening technique called the Therapeutically Guided Multidrug Optimization (Supplementary Information) used to identify a four-drug combination consisting of panobinostat, vorinostat, axitinib, and pictilisib (PVAP). DoE, design of experiment. (B). Schematic representation of a cancer cell to visualize the proteins targeted by the drugs within the PVAP (panobinostat, vorinostat, axitinib, and pictilisib). (C,D). Bar graphs representing the ATP levels, hence cell viability, in response to the treatment with the PVAP in a 2D monolayer culture (2D), in homotypic 3D cultures (3Dc), in heterotypic 3D co-cultures (3Dcc), and 3Dcc supplemented with immune cells (3Dccimm) of Caki-1 (C) and Caki-1-SR cells (D). Error bars represent the SD. Statistical significance was calculated with n = 3 independent experiments by using a two-way ANOVA test with unequal variances; ** p < 0.01. (E). The movement of THP-1 and Jurkat cells during 14 h after administration on top of Caki-1-based 3Dcc spheroids measured as the number of tracks. The graphic shows the comparison of the CTRL versus PVAP or 5 µM sunitinib treatment. (F). Representation of the analysis to count immune cells in the different layers of a 3Dcc spheroid after infiltration. (G,H). Comparison of Caki-1- and Caki-1-SR-based 3Dcc spheroids after 12 h of infiltration through THP-1 (G) or Jurkat cells (H) in different z-stack layers upon treatment with PVAP or 5 µM sunitinib. Error bars represent the SD. Statistical significance was calculated with n = 2 independent experiments by using a one-way ANOVA test with unequal variances; * p < 0.05, *** p < 0.001.

