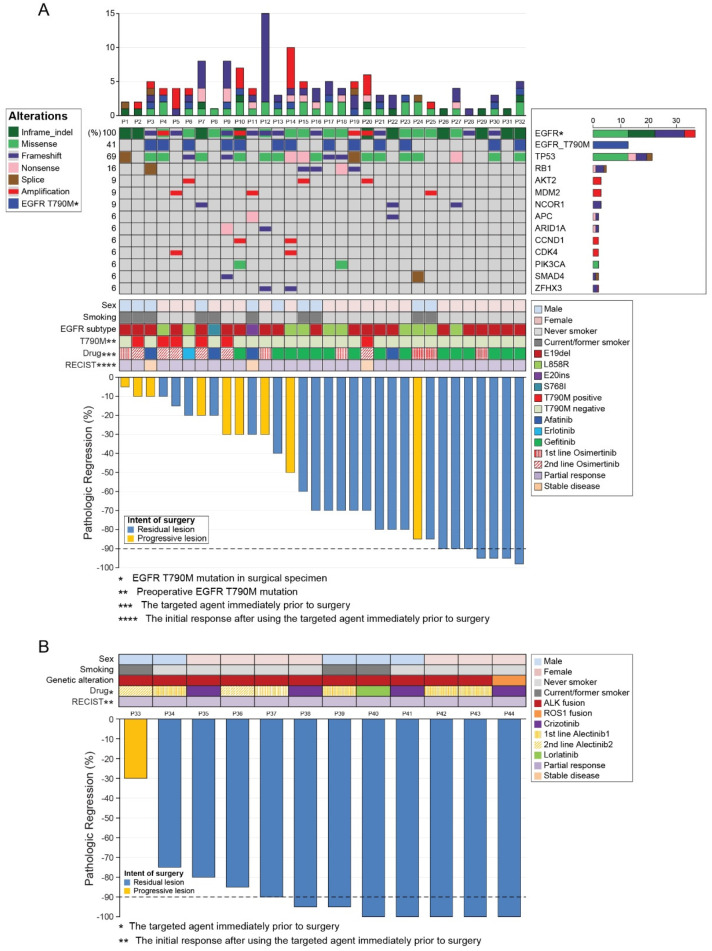
Figure 2.
Landscape of mutation profiles and pathological responses at the primary lesion. (A) Landscape of mutation profiles analyzed using next-generation sequencing of samples from the 32 patients with EGFR mutations. The X-axis represents individual samples, and the Y-axis represents individual mutated genes. The bar graph on the right shows the mutation frequency of each mutated gene in the 32 samples. The top column represents tumor mutation burden. Different colors and notes at the left represent mutation types. Middle rows indicate sex, smoking status, EGFR mutation subtype, presence of the T790M mutation before surgery, targeted agent immediately before surgery, and best response after using the targeted agent immediately before surgery. The Waterfall chart at the bottom shows the pathologic response at the primary lesion of the 32 patients with EGFR mutations. (B) The Waterfall chart shows the pathologic response at the primary lesion of the 12 patients with ALK or ROS1 fusions. Upper rows indicate sex, smoking status, genetic alteration, targeted agent immediately before surgery, and best response after using the targeted agent immediately before surgery. RECIST: Response Evaluation Criteria in Solid Tumors.

