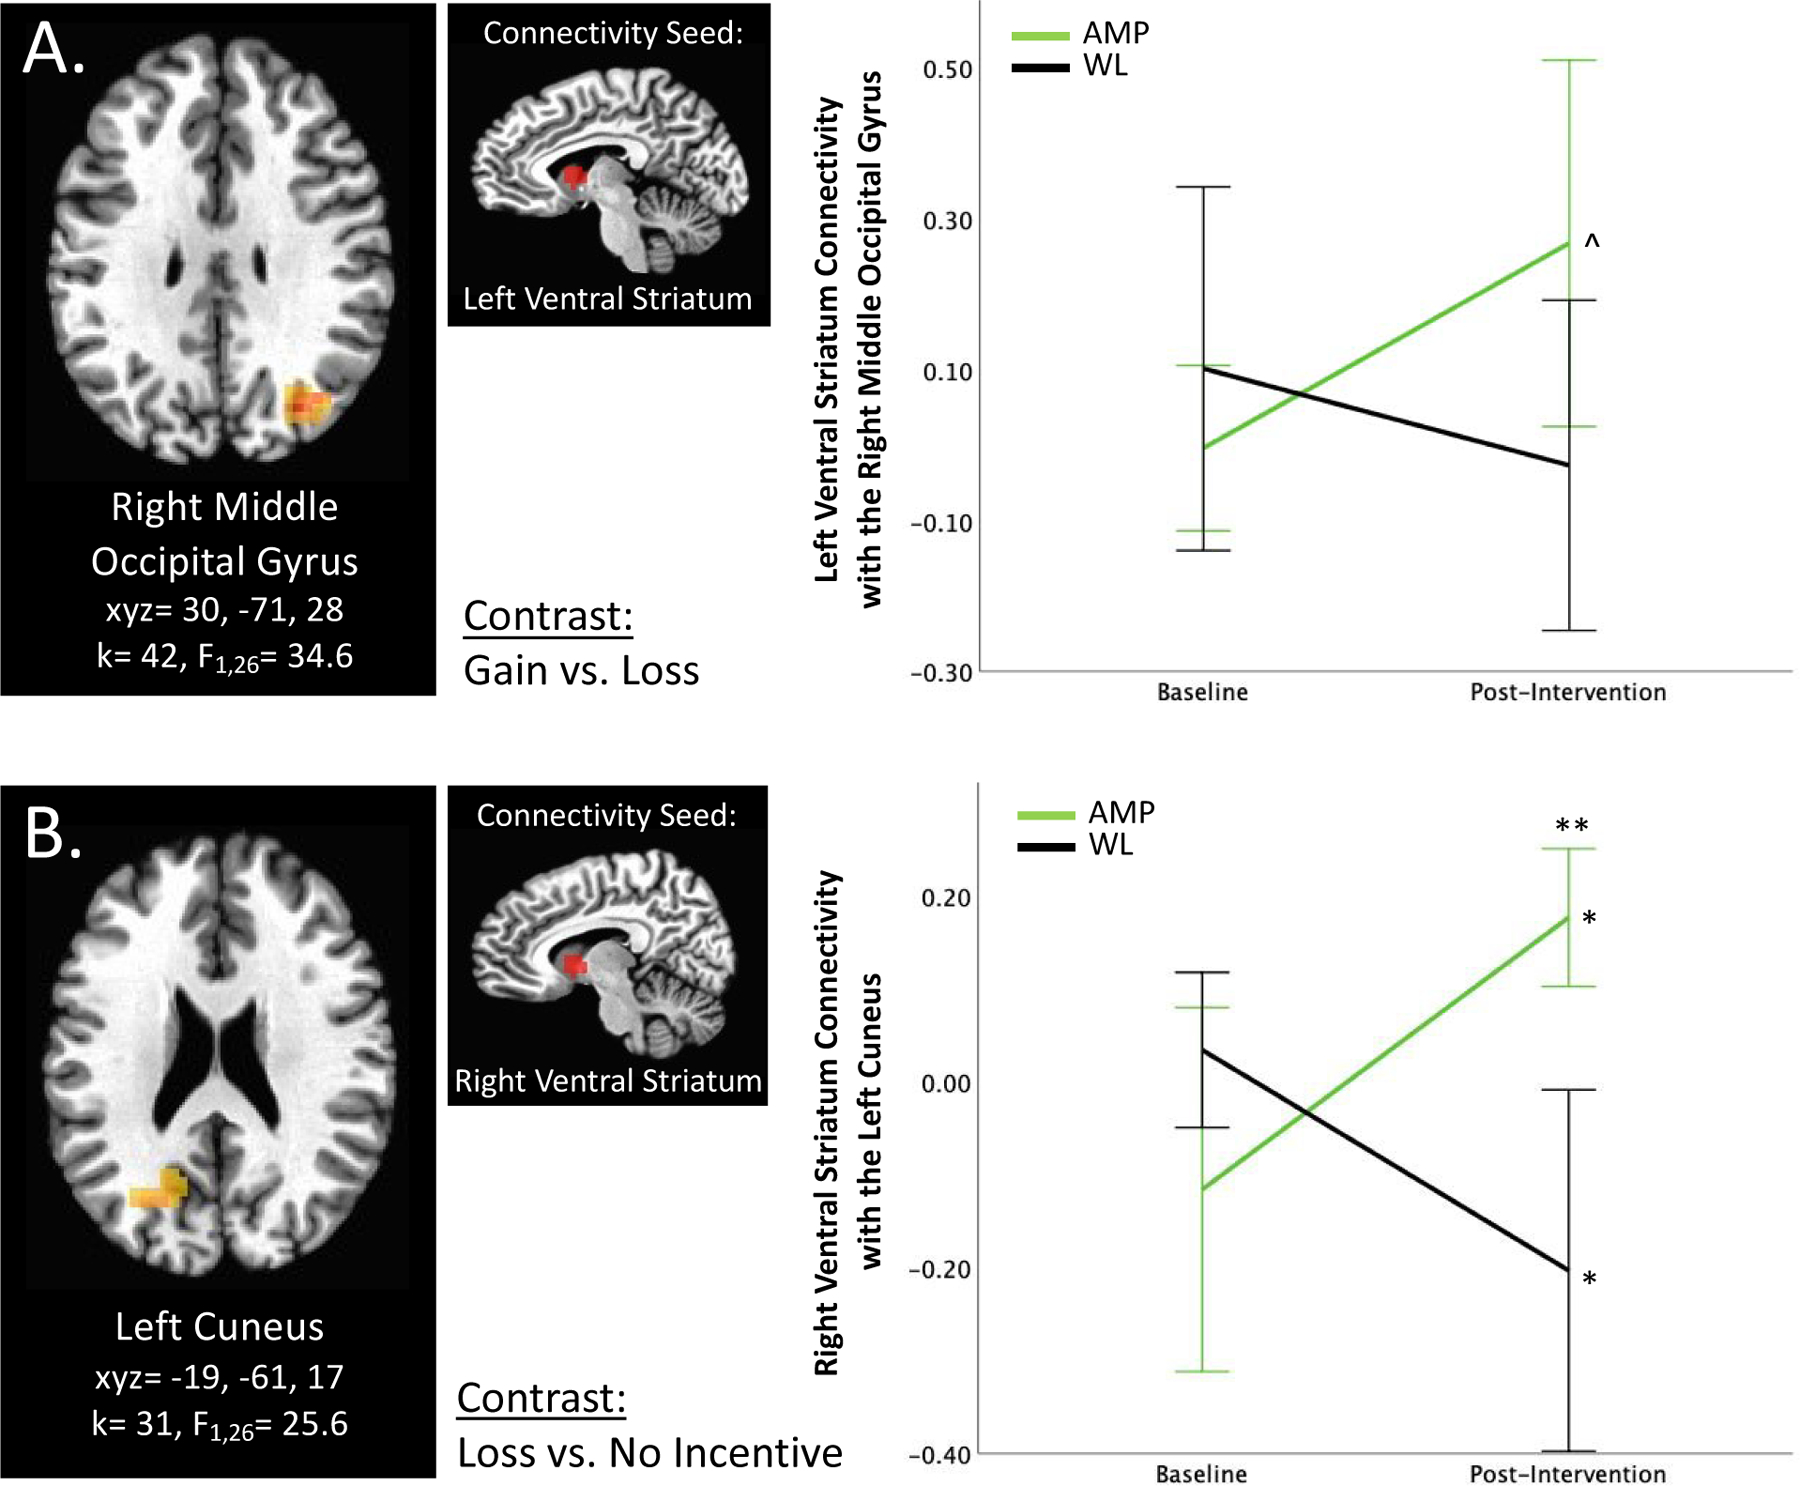
Figure 1. Ventral Striatum Connectivity.

A) Group × Time × Gain vs. Loss interaction predicts left ventral striatum connectivity with the right middle occipital gyrus. B) Group × Time × Loss vs. No Incentive interaction predicts right ventral striatum connectivity with the left cuneus. *p<0.05, ** p<0.01, ^p<0.1, corrected. Error bars represent 95% confidence interval. AMP=treatment group that underwent Amplification of Positivity, WL=waitlist control group that did not undergo an intervention. For this and all figures, brain images represent axial sections (left=left) with threshold set at whole-brain-corrected p<.05.
