Figure 1.
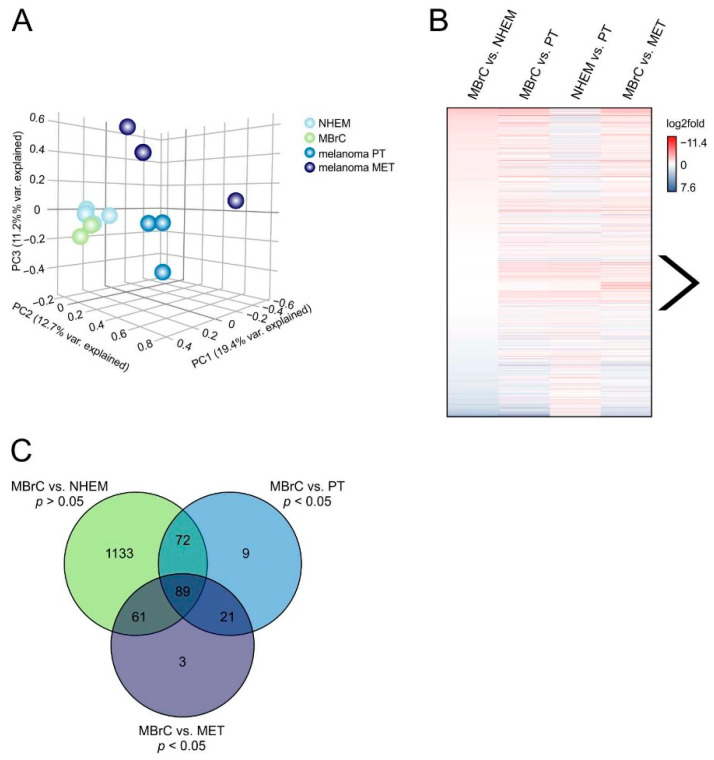
miRNA sequencing in NHEMs, MBrCs, and melanoma cell lines reveals a group of miRNAs, which are strongly regulated only in melanoma. (A) Principal component analysis of miRNA-seq data plot of the first three principal components (PCs). Samples with related gene expression profiles are closer in the three-dimensional embedding. Each sphere represents an RNA-seq sample, and replicates are shown in the same color: NHEM (n = 4), MBrC (n = 2), melanoma primary tumor (PT) cell lines Mel Juso, Mel Wei and Mel Ei, melanoma metastasis (MET) cell lines Mel Im, Mel Ju and Hmb2. (B) Differential gene expression analysis of miRNA-seq data in the indicated sample pairs is shown as a heatmap of log2fold values. The arrow indicates miRNAs, which are equally expressed in MBrCs and NHEMs but strongly upregulated in melanoma cell lines. (C) Venn diagram of miRNAs that are not significantly differentially expressed in MBrCs vs. NHEMs (p-value > 0.05) but significantly differentially expressed (p-value < 0.05) in MBrCs vs. melanoma primary tumor (PT) or metastasis-derived (MET) melanoma cell lines.

