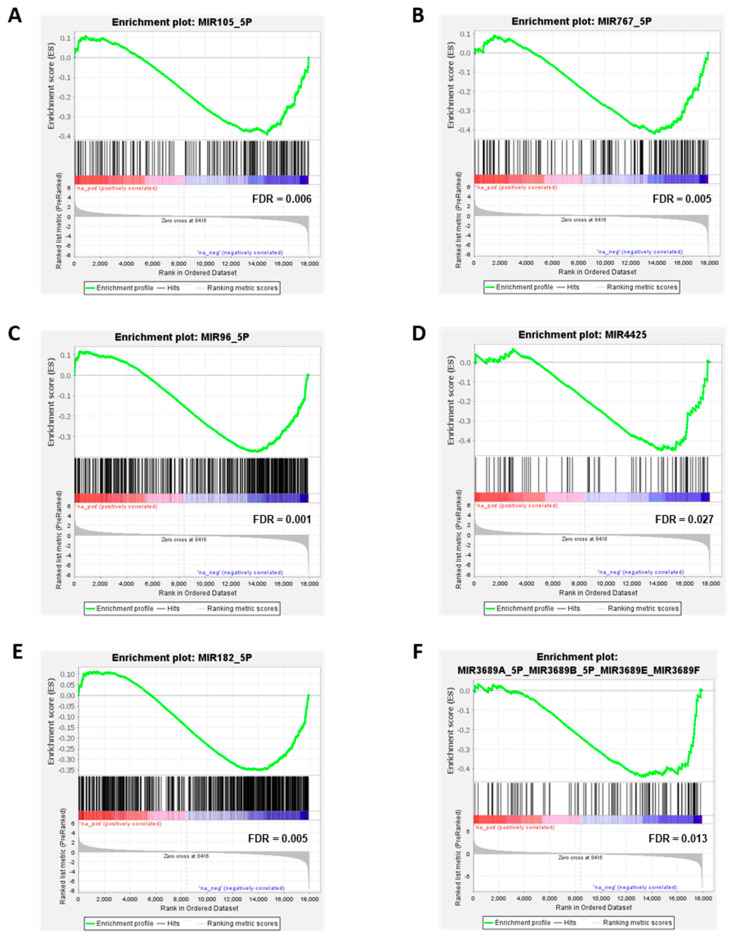
Figure 4.
Significant downregulation of miRNA target genes in melanoma cells. Enrichment plot for (A) miR-105-5p, (B) miR-767-5p, (C) miR-96-5p, (D) miR-4425, (E) miR-182-5p, and (F) miR-3689F. Profile of the running enrichment score (green) and positions of gene set members of the respective miRNA target genes on the rank-ordered list of genes differentially regulated in melanoma cells compared to MBrCs and NHEMs identified by gene expression array analysis. Genes upregulated in melanoma are shown on the left side of the graph in red, genes downregulated in melanoma on the right side in blue.

