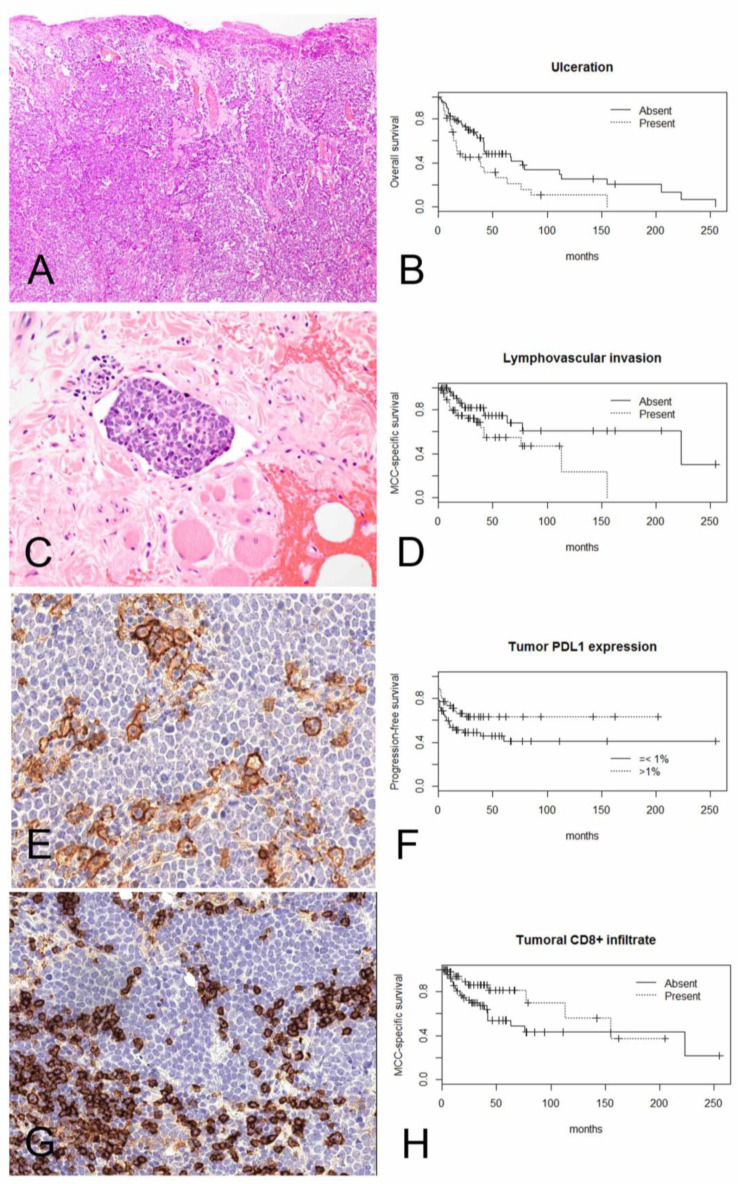
Figure 1.
Kaplan–Meier curves demonstrate significant correlation between (A) presence of ulceration (10×) and (B) worse overall survival (log-rank p = 0.0039); (C) presence of lymphovascular invasion (40×) and (D) worse MCC-specific survival (log-rank p = 0.02); (E) membranous PD-L1 expression >1% of tumor cells (20×) and (F) improved progression-free survival (log-rank p = 0.041); (G) intratumoral CD8+ lymphocytes and (H) improved Merkel cell carcinoma-specific survival (log-rank p = 0.031).

