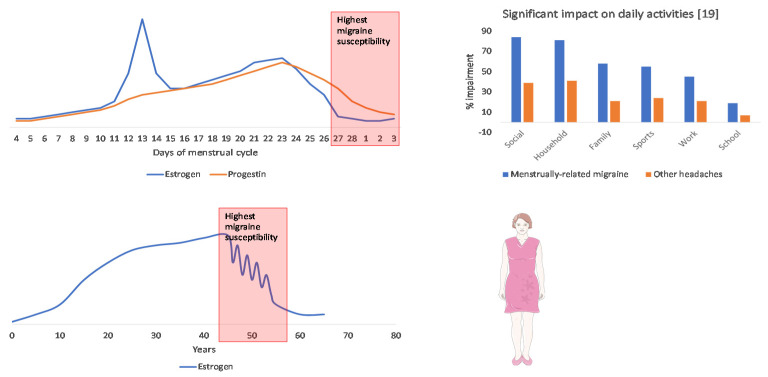
Figure 3.
Graphical representation of the menstrual and perimenopausal periods of increased susceptibility to migraine and women’s quality of life impairment. The panels on the left indicate the levels of female sex hormones during the menstrual cycle (above) and the years of women’s life (below). The graph on the right shows the proportion of women reporting impairment of daily activities due to menstrual-related migraine (blue columns) compared with other headaches (orange columns; data from [19]).

