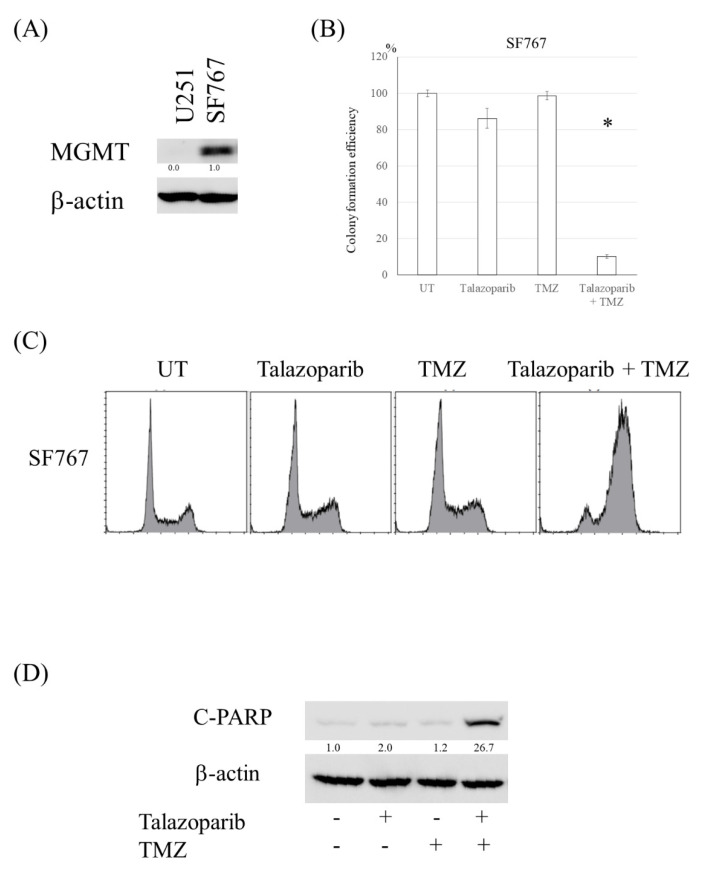
Figure 4.
PARP inhibitor resensitized cells with high expression of MGMT to TMZ. (A) Western blot analysis of MGMT and β-actin levels in SF767 cells. U251 was used as negative control for MGMT expression. (B) Colony formation efficiency of SF767 cells following talazoparib (2.5 nM, 4 days), and/or TMZ (100 μM, 3 h). (C) Fluorescence-activated cell sorting analysis of cell cycle distribution in SF767 cells after talazoparib and/or TMZ exposure. (D) Western blot analysis of cleaved PARP and β-actin levels in SF767 cells treated with talazoparib and/or TMZ. *, p < 0.05.

