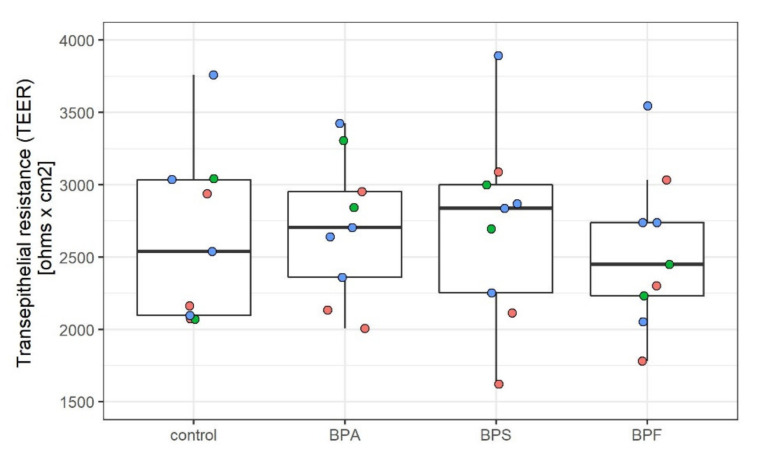
Figure 1.
Effect of bisphenols on barrier integrity. Each dot represents the average transepithelial resistance (TEER) of three transwells within one experiment, and the overlying box plots depict median value and the interquartile range (IQR) plus whiskers up to the lowest/highest value <1.5 × IQR. Red = BMECs derived with protocol 1, i.e., hypoxia 10 days protocol (n = 3), Green = BMECs derived with protocol 2, i.e., normoxia 8 days protocol (n = 2), Blue = BMECs derived with protocol 3, i.e., protocol 2, but frozen day 6 and exposed only in transwells (48 h) (n = 4). The Kruskal–Wallis test showed no significant differences between the treatment groups.

