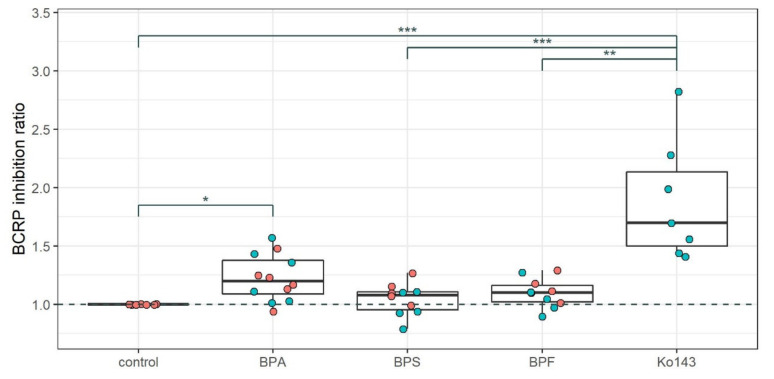
Figure 2.
BCRP inhibition by bisphenols in the BBB model. BCRP inhibition = Intracellular Hoechst 33342 accumulation relative to control, where an increased signal indicates less transport of this fluorescent BCRP substrate out of the cells. Each dot represents relative Hoechst accumulation, and the overlying box plots depict median value and the interquartile range (IQR) plus whiskers up to the lowest/highest value < 1.5 × IQR. Pink = 8–10 days exposure; blue = 2 h exposure. Data stems from 7 different experiments, all using protocol 1 or 2. Not all experiments contained both treatment times or all treatments. n(Ko143) = 7, n(BPA) = 12, n(BPS) = 10, n(BPF) = 10. Ko143 = known BCRP inhibitor. * = p < 0.05, ** = p < 0.01, *** = p < 0.001 indicate statistical significance, obtained with the Kruskal–Wallis test and Dunn’s post-hoc test using FDR correction for multiple testing.

