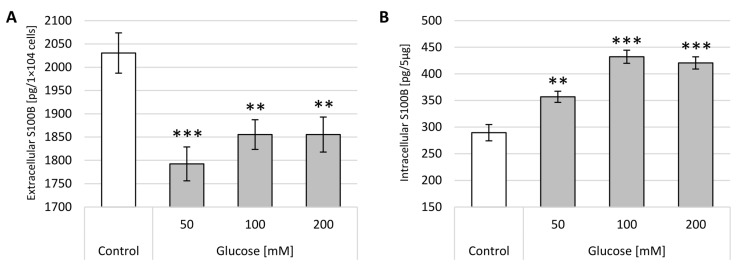
Figure 6.
S100B protein concentration in neuron-like cells after incubation with different glucose concentrations (50, 100 and 200 mM). Control—untreated cells. (A) extracellular S100B levels per 1 × 10⁴ cells; (B) intracellular S100B levels per 5 µg of total cellular protein concentration. Statistically significant differences compared to the untreated neuron-like cells: ** p < 0.01, *** p < 0.001.

