Figure 5.
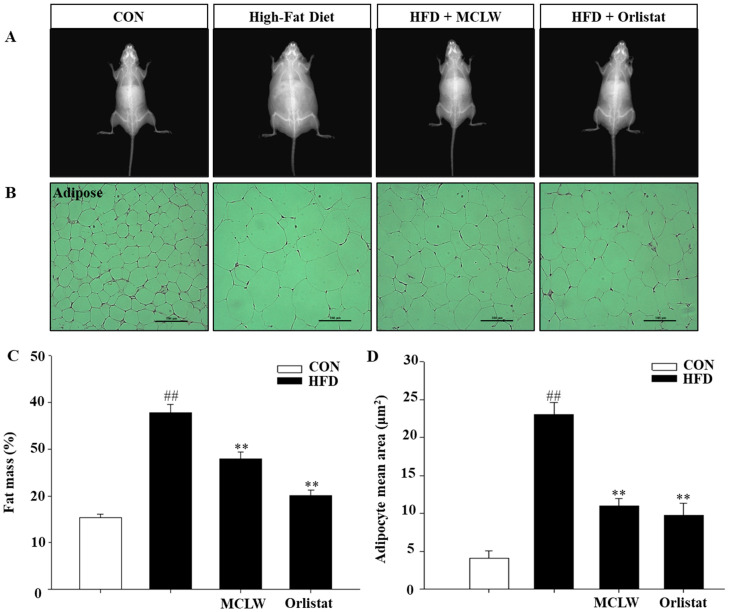
Changes in fat mass and adipocyte size in mice from normal and HFD diets groups, CON groups were fed normal diet, HFD groups fed high fat diet, HFD with MCLW 200 mg/kg, and HFD with Orlistat 60 mg/kg. (A) The radiography of body fat is displayed. (B) MCLW reduces lipid accumulation in the adipose tissue. (C) Fat mass values are reported relative to the body weight (n = 8 per group). (D) Adipocyte mean area (μm2) (n = 3 per group). Data are mean ± SEM. Student’s unpaired t-test with Benjamini–Hochberg correction, ## p < 0.01 vs. the normal diet (CON); ** p < 0.01 vs. the HFD (n = 8).

