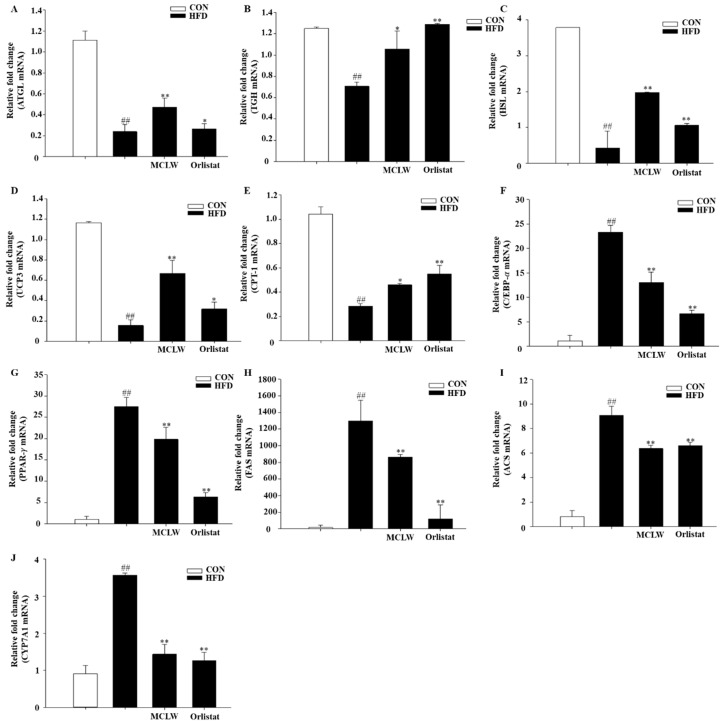
Figure 7.
mRNA expression in mouse liver as measured in real time PCR. The charts showed expression levels with ATGL (A), TGH (B), HSL (C), UCP3 (D), CPT-1 (E), C/EBP-α (F), PPAR-γ (G), FAS (H), ACS (I), CYP7A1 (J). All the data represented the relative fold change of mRNA expression of the genes of interest. The fold-change for each gene is relative to CON mRNA levels. Data are mean ± SEM. n = 8, Student’s unpaired t-test with Benjamini–Hochberg correction, ## p < 0.01 vs. the CON. * p < 0.05, ** p < 0.01 vs. the HFD (n = 3).

