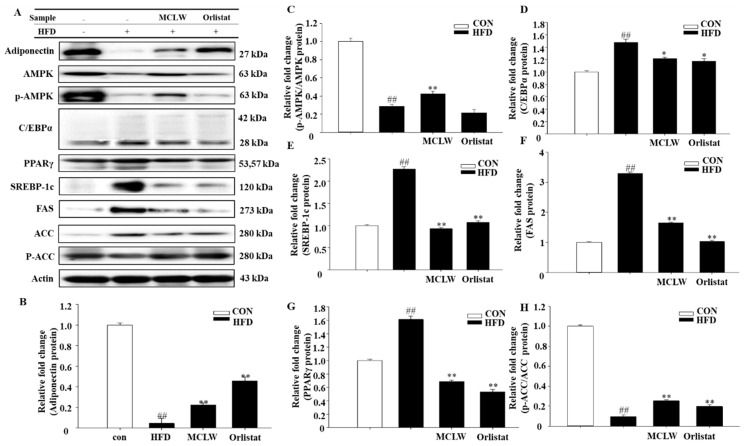
Figure 8.
Western blot (A). Adiponectin (B), p-AMPK/AMPK (C), C/EBPα (D), PPAR-γ (E), SREBP-1c (F), FAS (G), and p-ACC/ACC (H) protein expression levels, normalized relative protein expression data to actin expression levels. Data are mean ± SEM. n = 3, Student’s unpaired t-test with Benjamini–Hochberg correction, ## p < 0.01 vs. the CON. * p < 0.05, ** p < 0.01 vs. the HFD.

