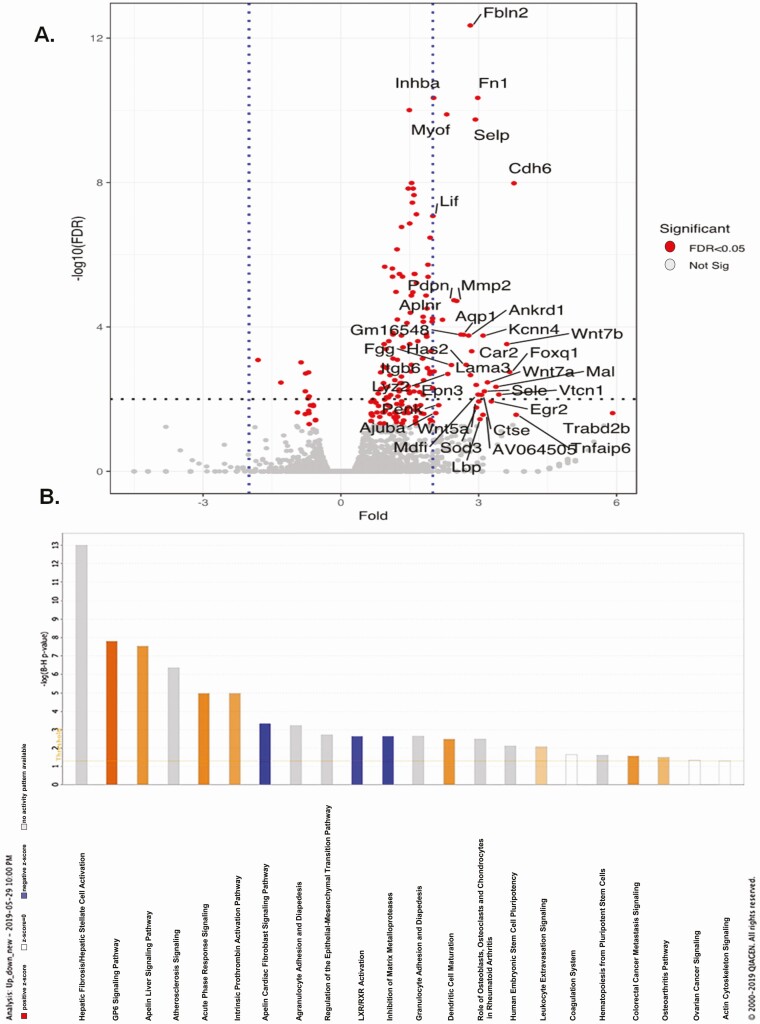
Figure 6.
Transcriptomic profiling of TAZ KD islets revealed increased expression of extracellular matrix protein. Islet genes plotted as fold change against -log10(FDR) in a volcano plot. (A) Significantly regulated genes (>1.5-fold) are marked in red. (B) Highly enriched transcriptional pathways from the Ingenuity Pathway Analysis of mouse islet mRNA. Orange bars represent positive z-score, open bars represent z-score = 0, blue bars represent negative z-score, gray bars represent no activity pattern available. FDR, false discovery rate; KD, knock-down, TAZ, tafazzin.

