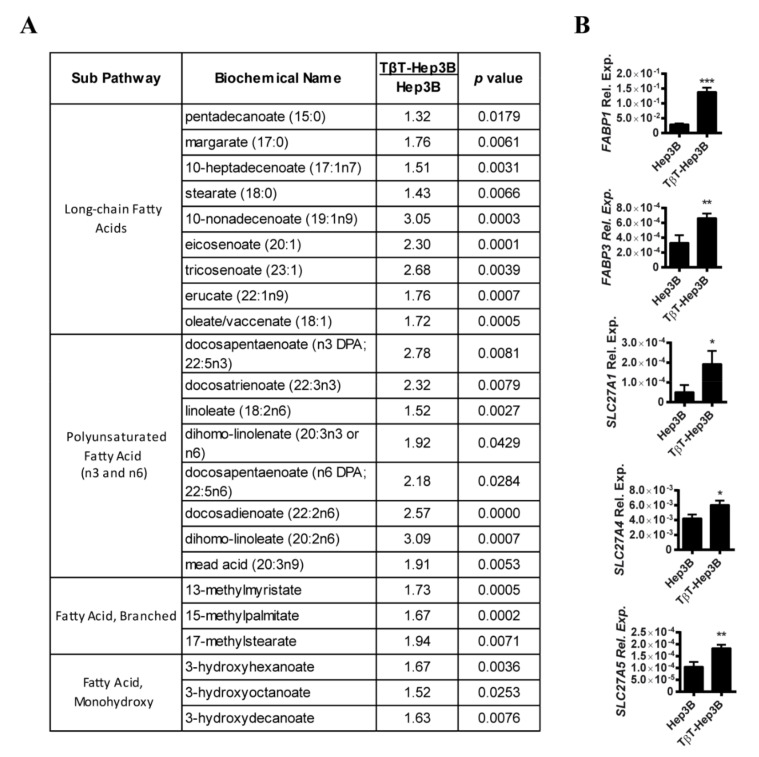
Figure 1.
Chronic TGF-β treatment in Hep3B cells led to an increase in fatty acid content. (A) Fatty acid metabolites of TβT-Hep3B compared to Hep3B presented in fold. Welch’s two-sample t-test was used to identify biochemicals that differed significantly between experimental groups (n = 5 for each group, p value indicated in the right column). (B) Expression of genes related to fatty acid transport that changed significantly between Hep3B and TβT-Hep3B. Mean ± SD (n = 3). * p < 0.05, ** p < 0.01, *** p < 0.001.

