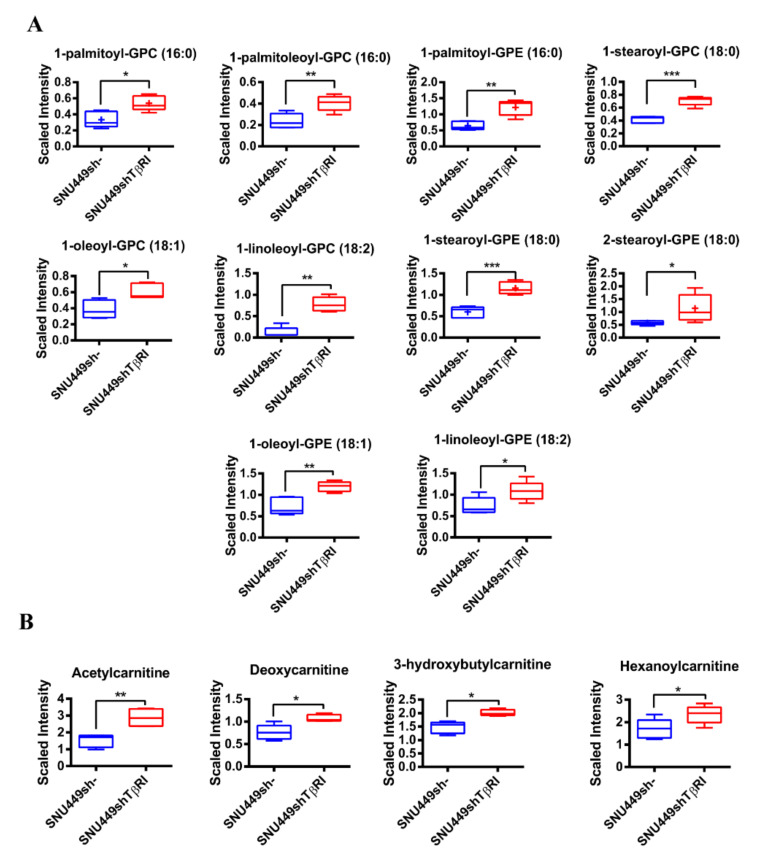
Figure 4.
Lipidomic analysis in SNU449shTβRI cells. Levels of lysolipids (A) and carnitine-related metabolites (B) are depicted by a box plot with whiskers (min to max). Welch’s two-sample t-test was used to identify biochemicals that differed significantly between experimental groups (n = 5 for each group). * p < 0.05, ** p < 0.01, *** p < 0.001.

