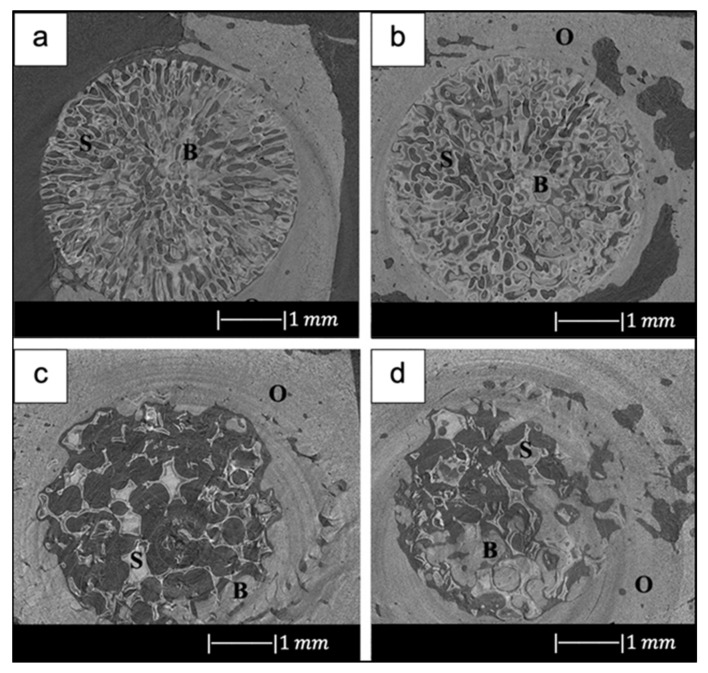
Figure 17.
Synchrotron micro-computed X-ray tomography images of 13-93 BG oriented scaffold after implantation for (a) 12 weeks and (b) 24 weeks, and 13-93 BG trabecular scaffold after implantation for (c) 12 weeks and (d) 24 weeks. The distribution of old bone (O), new bone (B), and the bioactive glass scaffold (S) is given. Figure reproduced with permission from Liu et al. [34].

