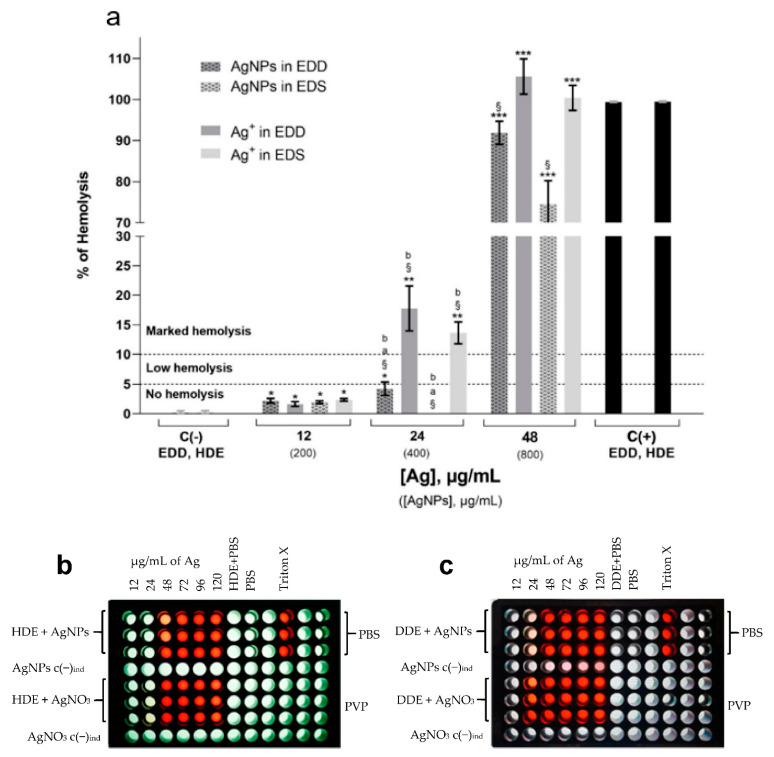
Figure 2.
(a) Hemolysis in diabetic donor erythrocytes (DDE) and healthy donor erythrocytes (HDE) induced by AgNPs and Ag+, PBS negative controls C(−) and Triton X-100 C(+). Dotted horizontal lines separate the limits of no hemolysis (<5%), low hemolysis (5–10%), and marked hemolysis (>10%). The average of PBS negative controls C(−) and Triton X-100 positive controls C(+) are presented. The standard error of the mean (SEM) is shown in each bar. p-value is indicated on the top of each bar, * (p ≤ 0.05), ** (p ≤ 0.01), and *** (p ≤ 0.001) compared with the negative control. § p ≤ 0.01 compared to positive control. a p ≤ 0.01 comparing DDE vs. HDE, b significant difference comparing AgNPs vs. Ag+ in AgNO3. Values in parenthesis indicate complete formulation concentrations; 96-well plate layouts and supernatant appearance of (b) HDE and (c) DDE exposed to AgNPs and AgNO3 at various concentrations of Ag content.

