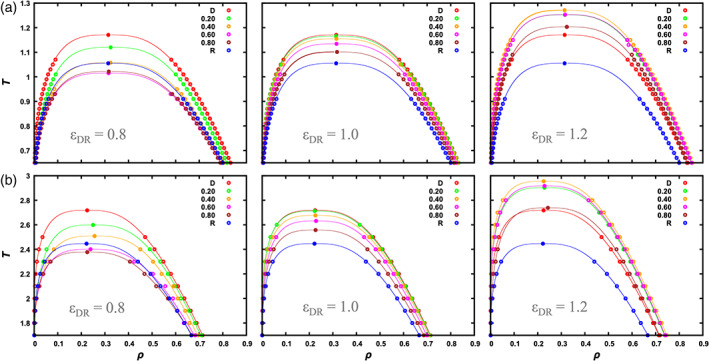
FIGURE 3.

Binodals of (a) particle and (b) chain systems. The driver‐regulator interaction strength, ε DR, is listed near the bottom of each panel; the mole fraction of the regulator species is listed at the top right. Symbols are densities of the two phases at a given temperature, determined by fitting the density profile to a hyperbolic tangent function. The curves are fits of the binodals to Equation [3]. Given the greater uncertainties near the critical region, we successively removed data closest to T c, until the fitted values of T c and ρ c were stable. 15 Note that at ε DR = 1.2 the results at x R = 0.2 and 0.6 are very close to each other, especially for the particle systems
