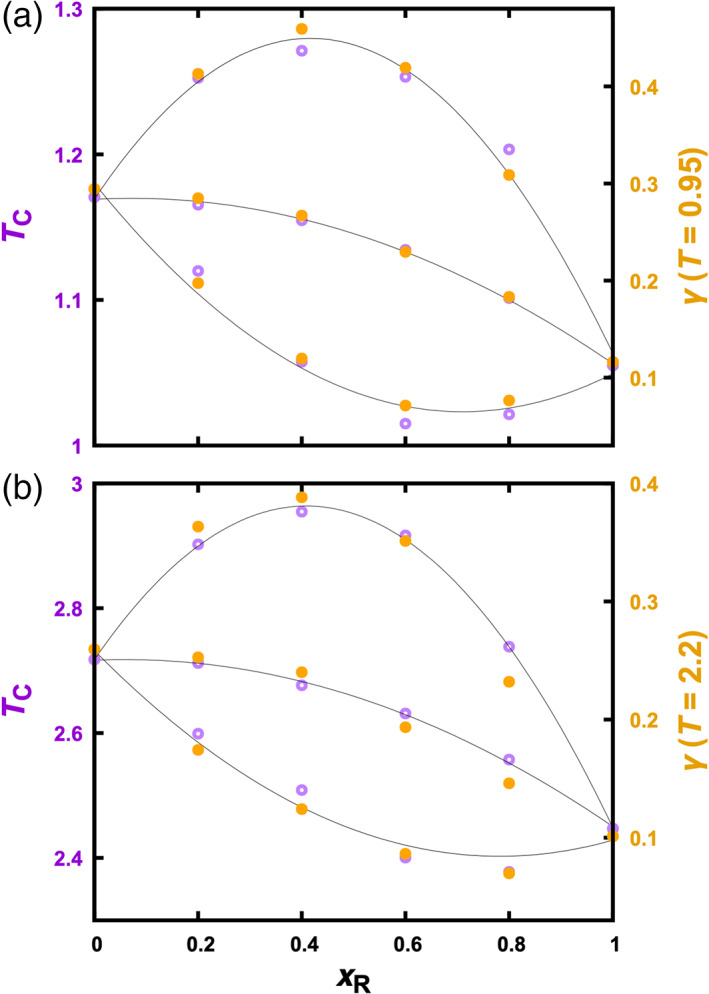
FIGURE 4.

Regulatory effects on T c and on γ. (a) Particle systems. (b) Chain systems. T c values are determined by fitting binodals. Curves are parabolic fits to guide the eye. Data at ε DR = 1.2, 1.0, and 0.8 are displayed from top to bottom in each panel
