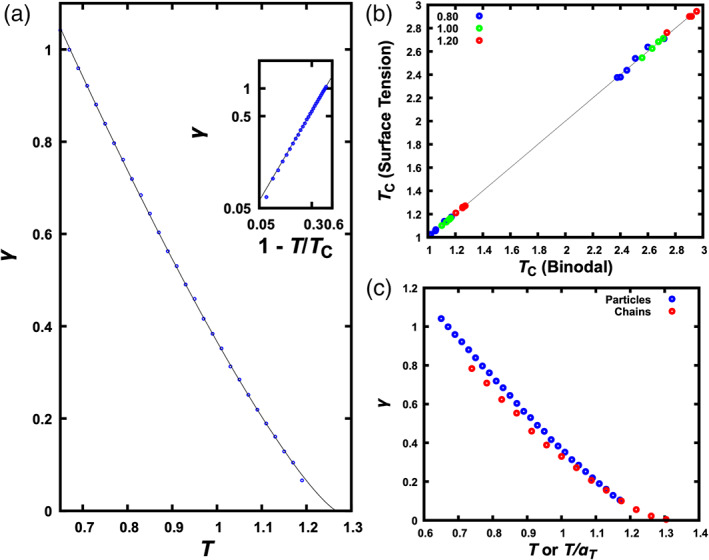
FIGURE 5.

Temperature dependence of interfacial tension. (a) Results for a mixture of Lennard‐Jones particles at ε DR = 1.2 and x R = 0.4. The curve is a fit to Equation [4]. The inset displays a similar plot but with both γ and 1 − T/T c on a logarithmic scale. (b) Comparison of critical temperatures determined via two different routes, by fitting either binodal or interfacial tension. Data points at the lower left and at the upper right are for particles and chains, respectively. The line represents perfect agreement between the two routes. (c) Comparison of interfacial tensions of the corresponding particle and chain systems at ε DR = 1.2 and x R = 0.4. For the chain system, the abscissa represents temperature scaled down by a factor α T= 2.3
