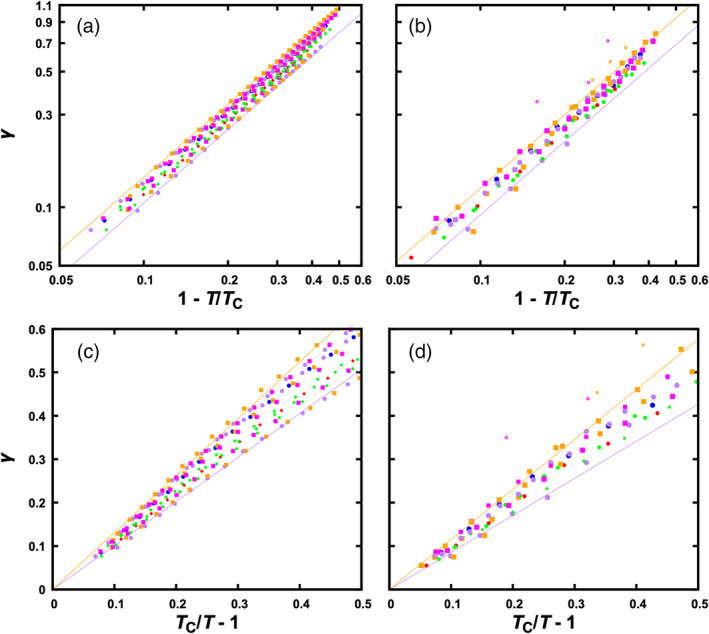
FIGURE 6.

Scaling of interfacial tension with T or with T c. (a) Scaling of γ with 1 − T/T c for the particle systems, displayed on a log–log scale. The fits to Equation [4] for two sets of data near the borders are shown as lines. (b) Corresponding plots for the chain systems. (c) Scaling of γ with T c/T − 1 for the particle systems. Fits to Equation [7], with T c fixed at the values from fitting interfacial tensions, for two sets of data (each for a given mixture in a range of T) near the borders are shown as lines. (d) Corresponding plots for the chain systems. Anomalous γ values due to multiphase coexistence are shown as open symbols in panels (b) and (d)
