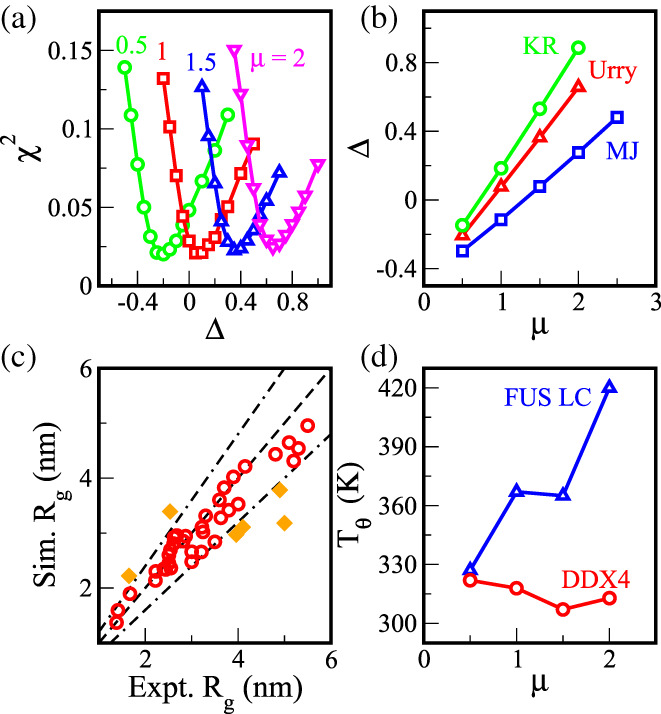
FIGURE 2.

(a) Fits to chi‐square values (χ2) from comparison of experimental and simulated Rg data on 42 IDP sequences on a range of shift (Δ) for a selected scale (μ) allows for locating the offset providing minimum chi square value. (b) Scale and offset for optimum chi‐square change linearly with respect to each other for Urry, Kapcha Rossky (KR), and Miyazawa Jernigan (MJ) interaction parameters. (c) Scatter plot of experimental and simulated Rg for 42 IDPs using an optimal model, Black (dot‐dash) lines represent 20% deviation in Rg. (scale (μ) = 1.0, offset (Δ) = 0.08) (d) T θ versus scale (μ) for FUS LC and DDX4 sequences shows a scenario where unique sequences might show drastic changes in behavior between different optimal models (μ, Δ)
