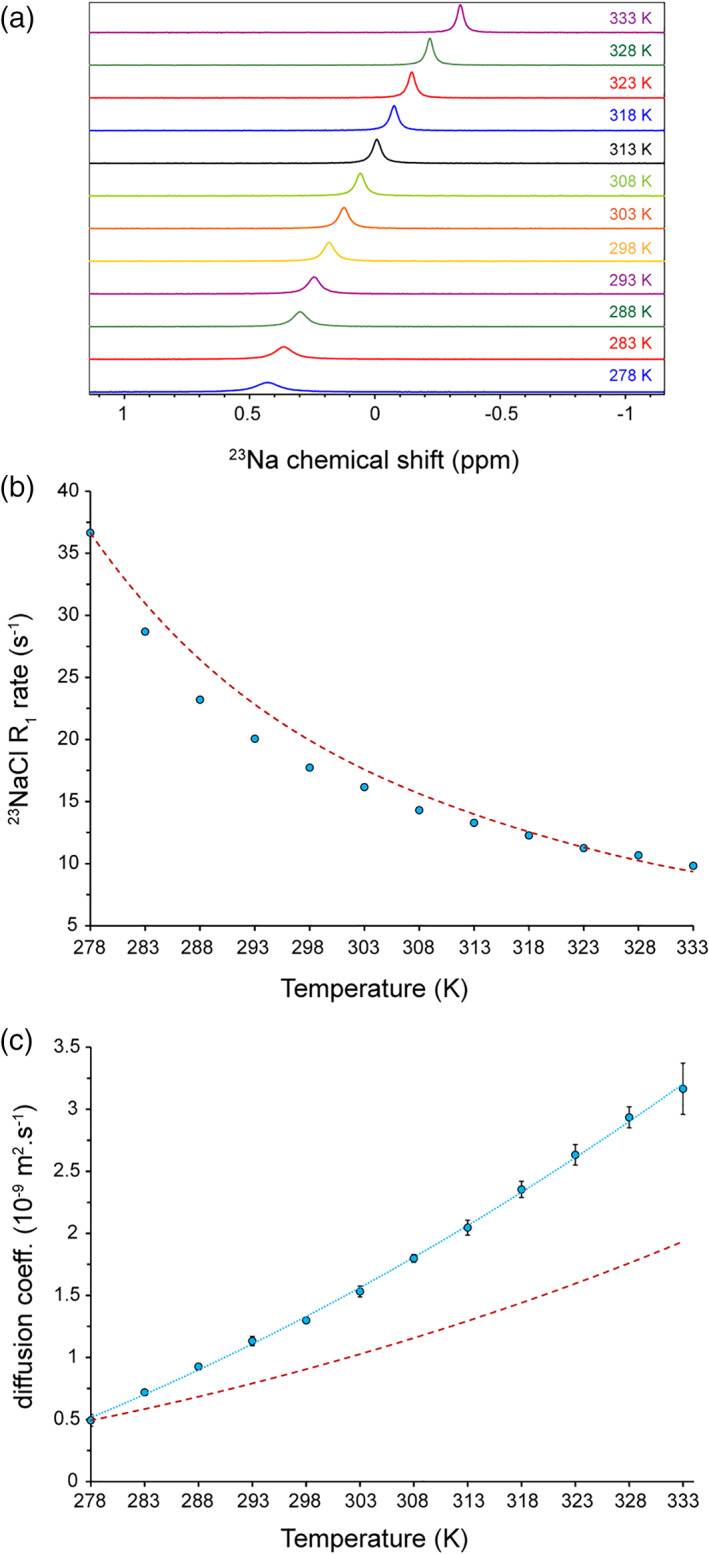
FIGURE 1.

Temperature dependence of 23Na NMR in 100 mM NaCl solution. (a) 1D 23Na NMR spectra reveal temperature‐dependent 23Na chemical shift changes and broadening. (b) The 23Na longitudinal relaxation (R 1) rates obtained from inversion‐recovery data at different temperatures (shown in Figure S1). The dashed line (dark red) shows the expected trend of R1 changes calculated based on the η/T ratio variation. The error bars are smaller than the symbol size. (c) Temperature dependence of 23NaCl translational diffusion coefficients (Dtr) obtained through PFG‐NMR diffusion experiments. The temperature‐dependent changes in Dtr is more pronounced than the expected trend calculated based on the T/η ratio variation (dashed line in dark red). PFG, pulse field gradient
